By Shelley Wenzel
This week, Energy Innovation launched the Oregon Energy Policy Simulator (EPS), our newest state-specific, open-source, peer-reviewed, and nonpartisan model that estimates the environmental, economic, and public health impacts of hundreds of climate and energy policies. The Oregon EPS joins our other state models, including California, Colorado, Louisiana, Minnesota, Nevada, and Virginia.
Recent climate policies in Oregon have established the state as a climate leader, including a stronger transportation sector clean fuels standard, new zero-emission medium- and heavy-duty truck standards, and legislation establishing a timeline to fully decarbonize the power sector by 2040. Nevertheless, state policymakers must take additional action to achieve Oregon’s greenhouse gas (GHG) emissions targets of at least 45 percent below 1990 emissions by 2035 and at least 80 percent below by 2050.
The Oregon EPS can help state policymakers measure progress and design additional emissions reductions policies in the buildings, transportation, land use, and industry sectors. Modeling results show that increased ambition is not only possible, but that it creates dramatic economic, employment, and public health benefits.
When layered on top of current state policies, a deep decarbonization scenario, consistent with the U.S. Nationally Determined Contribution under the Paris Climate Agreement (NDC Scenario), would cut economy-wide emissions 50 percent in 2035 and 74 percent in 2050 compared to 1990 levels. The NDC Scenario would also increase Oregon’s gross domestic product (GDP) by almost $4 billion annually, create more than 18,000 jobs, and avoid nearly 60 premature deaths and 900 asthma attacks annually in the year 2050.
Energy Innovation conducted analysis outlining five scenarios modeled with the Oregon EPS: the Business as Usual (BAU) Scenario, two Recent Policy Development scenarios, the Example Climate Protection Program (CPP) Scenario, and the NDC Scenario. The table below summarizes this research, showing total emissions under each policy scenario, along with the percentage of GHG emissions reductions below 1990 levels in 2035 and 2050 for each scenario.
Overall, we find that a strong electric vehicle (EV) sales standard and an EV subsidy, adopting fuel efficiency standards and supporting charging infrastructure buildout for EVs, and replacing fossil fuel equipment in buildings and industry with electric and other zero-carbon alternatives will be critical for cutting carbon emissions and consumer costs, while creating significant jobs and public health benefits.
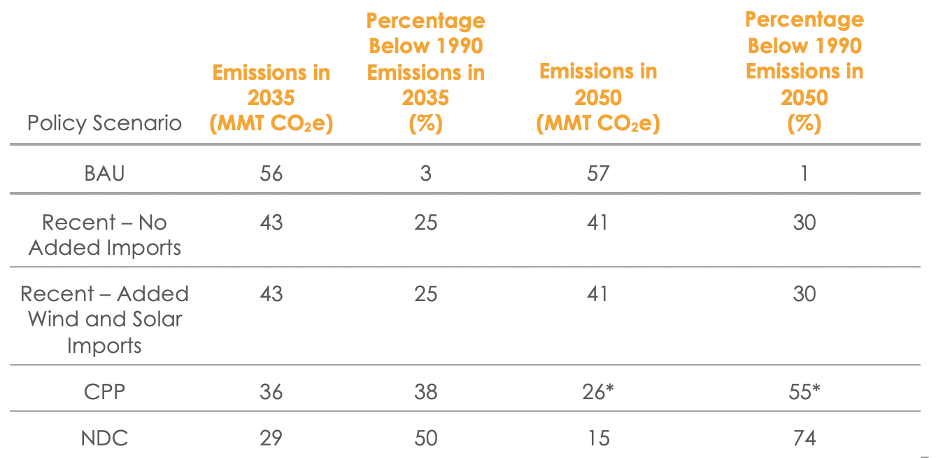
Table 1. EPS policy scenario results in 2035 and 2050 relative to EO 20-04 emissions goals of 45 percent reductions below 1990 levels by 2035 and 80 percent by 2050. Emissions in this table exclude the land use and land-use change sector. *The modeled CPP Scenario does not explicitly include the ~2.5 MMT of assumed Community Climate Investments (explained in the CPP footnote). Including Community Climate Investments, 2050 emissions would be 24 MMT, or a 60 percent reduction relative to 1990 emissions.
Business As Usual Scenario
The BAU Scenario estimates Oregon’s emissions trajectory prior to 2021 policy developments. With electricity as its own sector, Oregon’s two largest-emitting sectors in 2019 were transportation and electricity, at 35 percent and 29 percent of 2019 GHG emissions, respectively.[1] However as shown in Figure 1, when emissions from electricity generation are reallocated to the demand sectors, the GHG emissions breakdown by sector is as follows: 35 percent for transportation, 34 percent for buildings, 19 percent for industry, and 10 percent for agriculture. Decarbonizing electricity is crucial, especially within the buildings sector, since buildings create the largest electricity demand by a significant margin—at almost 70 percent.
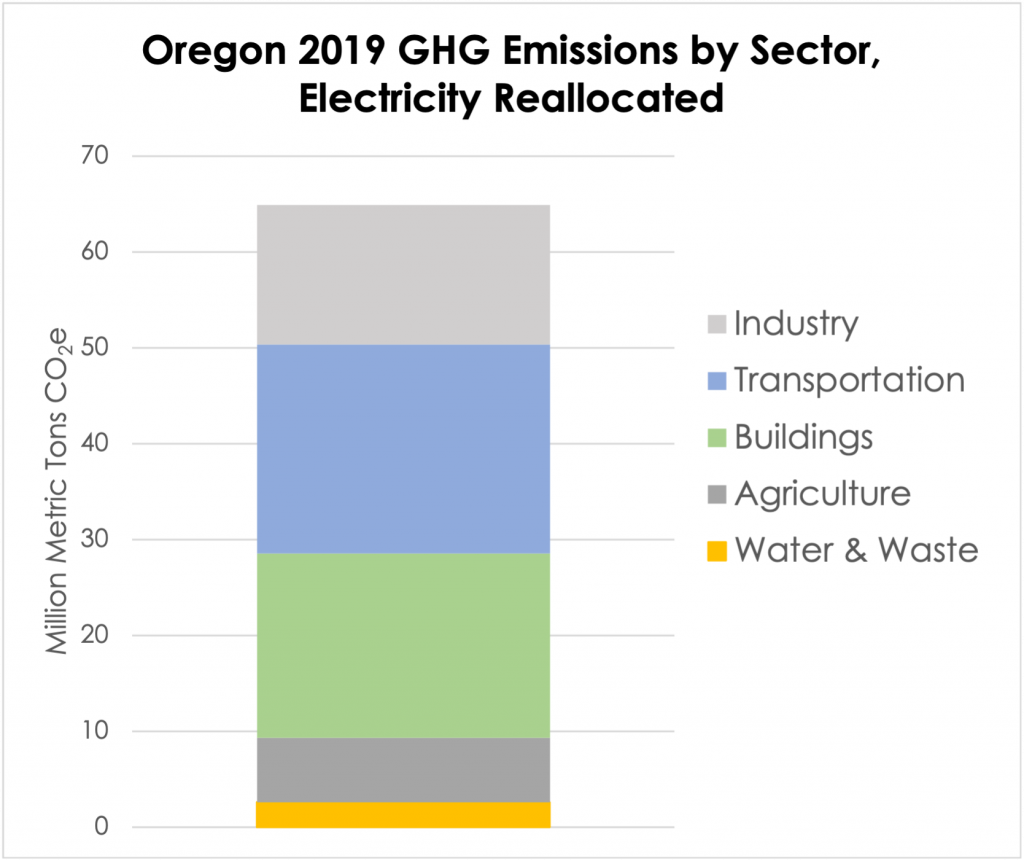
Figure 1. Oregon’s 2019 GHG emissions from Oregon DEQ’s GHG Sector-Based Inventory, with electricity emissions reallocated to respective demand sectors. Elements of the Inventory have been recategorized in line with the classification system used by the EPS.
Recent Policy Scenarios
In 2021, Oregon initiated rulemaking for the recently expanded Oregon Clean Fuels Program targets, passed legislation requiring retail electricity providers to reduce GHG emissions of electricity sold to consumers 100 percent below baseline by 2040 (HB2021), and adopted the Clean Trucks Rule. The “Recent Policy Developments – No Added Imports Scenario” (No Added Imports Scenario) and the “Recent Policy Developments – Added Wind and Solar Imports Scenario” (Added Wind and Solar Imports Scenario) bookend the range of expected electricity sector emissions due to uncertainty around the state’s reliance on imported electricity.
In these scenarios, transportation sector emissions decrease 3 percent in 2035 and 15 percent in 2050 compared to the BAU Scenario. The scenarios also add jobs, averaging nearly 500 new jobs in the year 2050. Results also show an increase in GDP compared to the BAU Scenario, with the No Added Imports Scenario forecasting $40 million and the Added Wind and Solar Imports Scenario forecasting $140 million in added GDP in 2050. Oregon EPS findings also show public health benefits due to reductions in air pollution from burning fossil fuels, with approximately 200 avoided asthma attacks annually by 2050. The resulting emissions reductions and avoided health impacts are also estimated to avoid $1.5 billion in damages annually by 2050.[2]
Example Climate Protection Plan Scenario
Oregon’s new Climate Protection Program (CPP) mandates an emissions cap for covered natural gas and transportation fuels rather than specific policy actions. Because the CPP does not yet have a clear policy set to implement the goals, we include an example CPP Scenario, which models one possible pathway by adding new policies and strengthening current policies on top of what is already included in the No Added Imports Scenario. The scenario uses a combination of policy levers to meet the annual emissions caps specified by the CPP. Results show the Example CPP Scenario creates nearly 9,600 jobs and generates $2.5 billion in GDP in 2050, while also avoiding 600 asthma attacks and 40 premature deaths annually in 2050. On a percent change basis, we find avoided deaths are greater for people of color—the percentage reduction in premature deaths is 40 to 90 percent greater for people identifying as Black, Asian, or ‘other race,’ compared to people identifying as white. Monetized health and climate benefits reach almost $3.1 billion in 2050, amounting to a cumulative $49 billion through 2050.
NDC Scenario
The NDC Scenario delivers the greatest emissions reductions, adapted from a nationwide policy scenario developed by EI to meet the U.S. NDC of 50 to 52 percent below 2010 emissions by 2030.[3] When layered on top of current state policies, this scenario reduces economy-wide emissions 50 percent in 2035 and 74 percent in 2050 compared to 1990 levels. Some of the policies implemented in this scenario include an EV sales standard paired with an EV subsidy lasting through 2030, policies to increase Oregon’s grid-scale electricity storage potential and adding transmission capacity, industry standards for clean fuel usage and lower process emissions, and improved energy efficiency in buildings paired with transitioning buildings away from burning fossil fuels. Figure 2 illustrates the deep GHG emissions reductions attributed to each policy and compared to Oregon’s BAU trajectory.
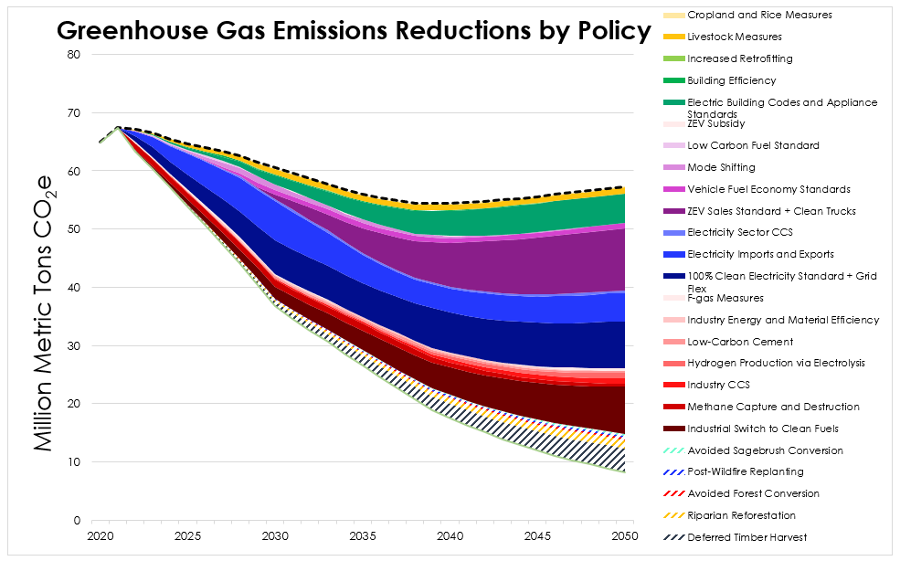
Figure 2. “Wedge” chart for the NDC Scenario. This graph shows GHG emissions excluding Oregon’s land use and land use change sector, consistent with the fact Oregon’s EO targets do not include land use. However, land use policies are included in the NDC Scenario showing additional carbon sequestration opportunities in the bottom striped wedges. Note this wedge chart aggregates some policy levers to improve figure readability; a full interactive wedge graph is available on the Oregon EPS.
In total, NDC scenario investments would increase the state’s GDP by almost $4 billion annually and create more than 18,000 jobs in 2050. This broader set of climate policies would also improve public health due to reductions in harmful air pollution from burning fossil fuels. The Oregon EPS estimates the NDC Scenario policies would avoid approximately 30 premature deaths and 400 asthma attacks annually in 2035; these numbers increase to nearly 60 avoided premature deaths and 900 asthma attacks annually by 2050. Like in the CPP scenario, we find that the percentage reduction in premature deaths is 50 to 90 percent greater for people identifying as Black, Asian, or ‘other race,’ compared to people identifying as white.
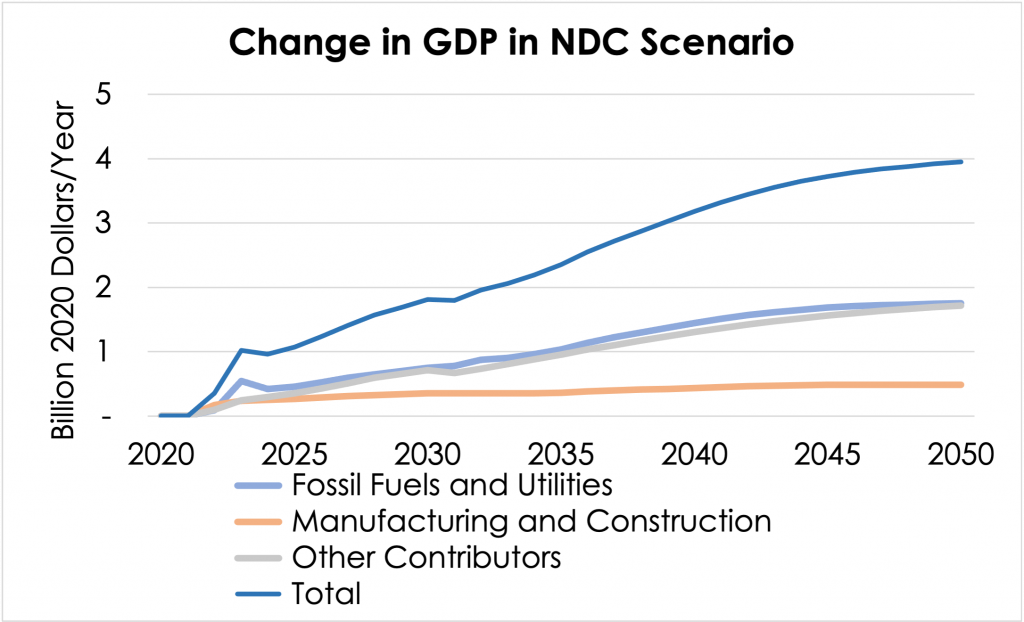
Figure 3. Projected changes in GDP relative to BAU in the NDC Scenario.
Next Steps For Oregon
Oregon has one of the fastest timelines in the nation for achieving clean power and has also adopted ambitious policies for decarbonizing transportation. Additional policies, particularly focused on electrification of transportation and buildings, can leverage this transition to achieve deeper decarbonization. EI’s NDC Scenario provides one possible policy pathway to cut emissions and achieve climate goals, while successfully growing the economy and creating new jobs. The Oregon EPS can help state policymakers measure progress and design effective emissions reductions policies in the buildings, transportation, land use, and industry sectors.
Notes
[1] Robbie Orvis, “A 1.5 Celsius Pathway To Climate Leadership For The United States” (Energy Innovation, n.d.), https://energyinnovation.org/wp-content/uploads/2021/02/A-1.5-C-Pathway-to-Climate-Leadership-for-The-United-States.pdf.
[2] Monetized co-benefits are calculated using the value of a statistical life as defined by the U.S. Environmental Protection Agency and the social cost of carbon as defined by the U.S. Interagency Working Group on Social Cost of Greenhouse Gases. “Technical Support Document: Social Cost of Carbon, Methane, and Nitrous Oxide Interim Estimates under Executive Order 13990” (Interagency Working Group on Social Cost of Greenhouse Gases, United States Government, February 2021), https://www.whitehouse.gov/wp-content/uploads/2021/02/TechnicalSupportDocument_SocialCostofCarbonMethaneNitrousOxide.pdf?source=email.
[3] “Oregon Greenhouse Gas Sector-Based Inventory Data,” Oregon DEQ, n.d., https://www.oregon.gov/deq/aq/programs/Pages/GHG-Inventory.aspx.