Report
Overcoming All Barriers To Industrial Electrification
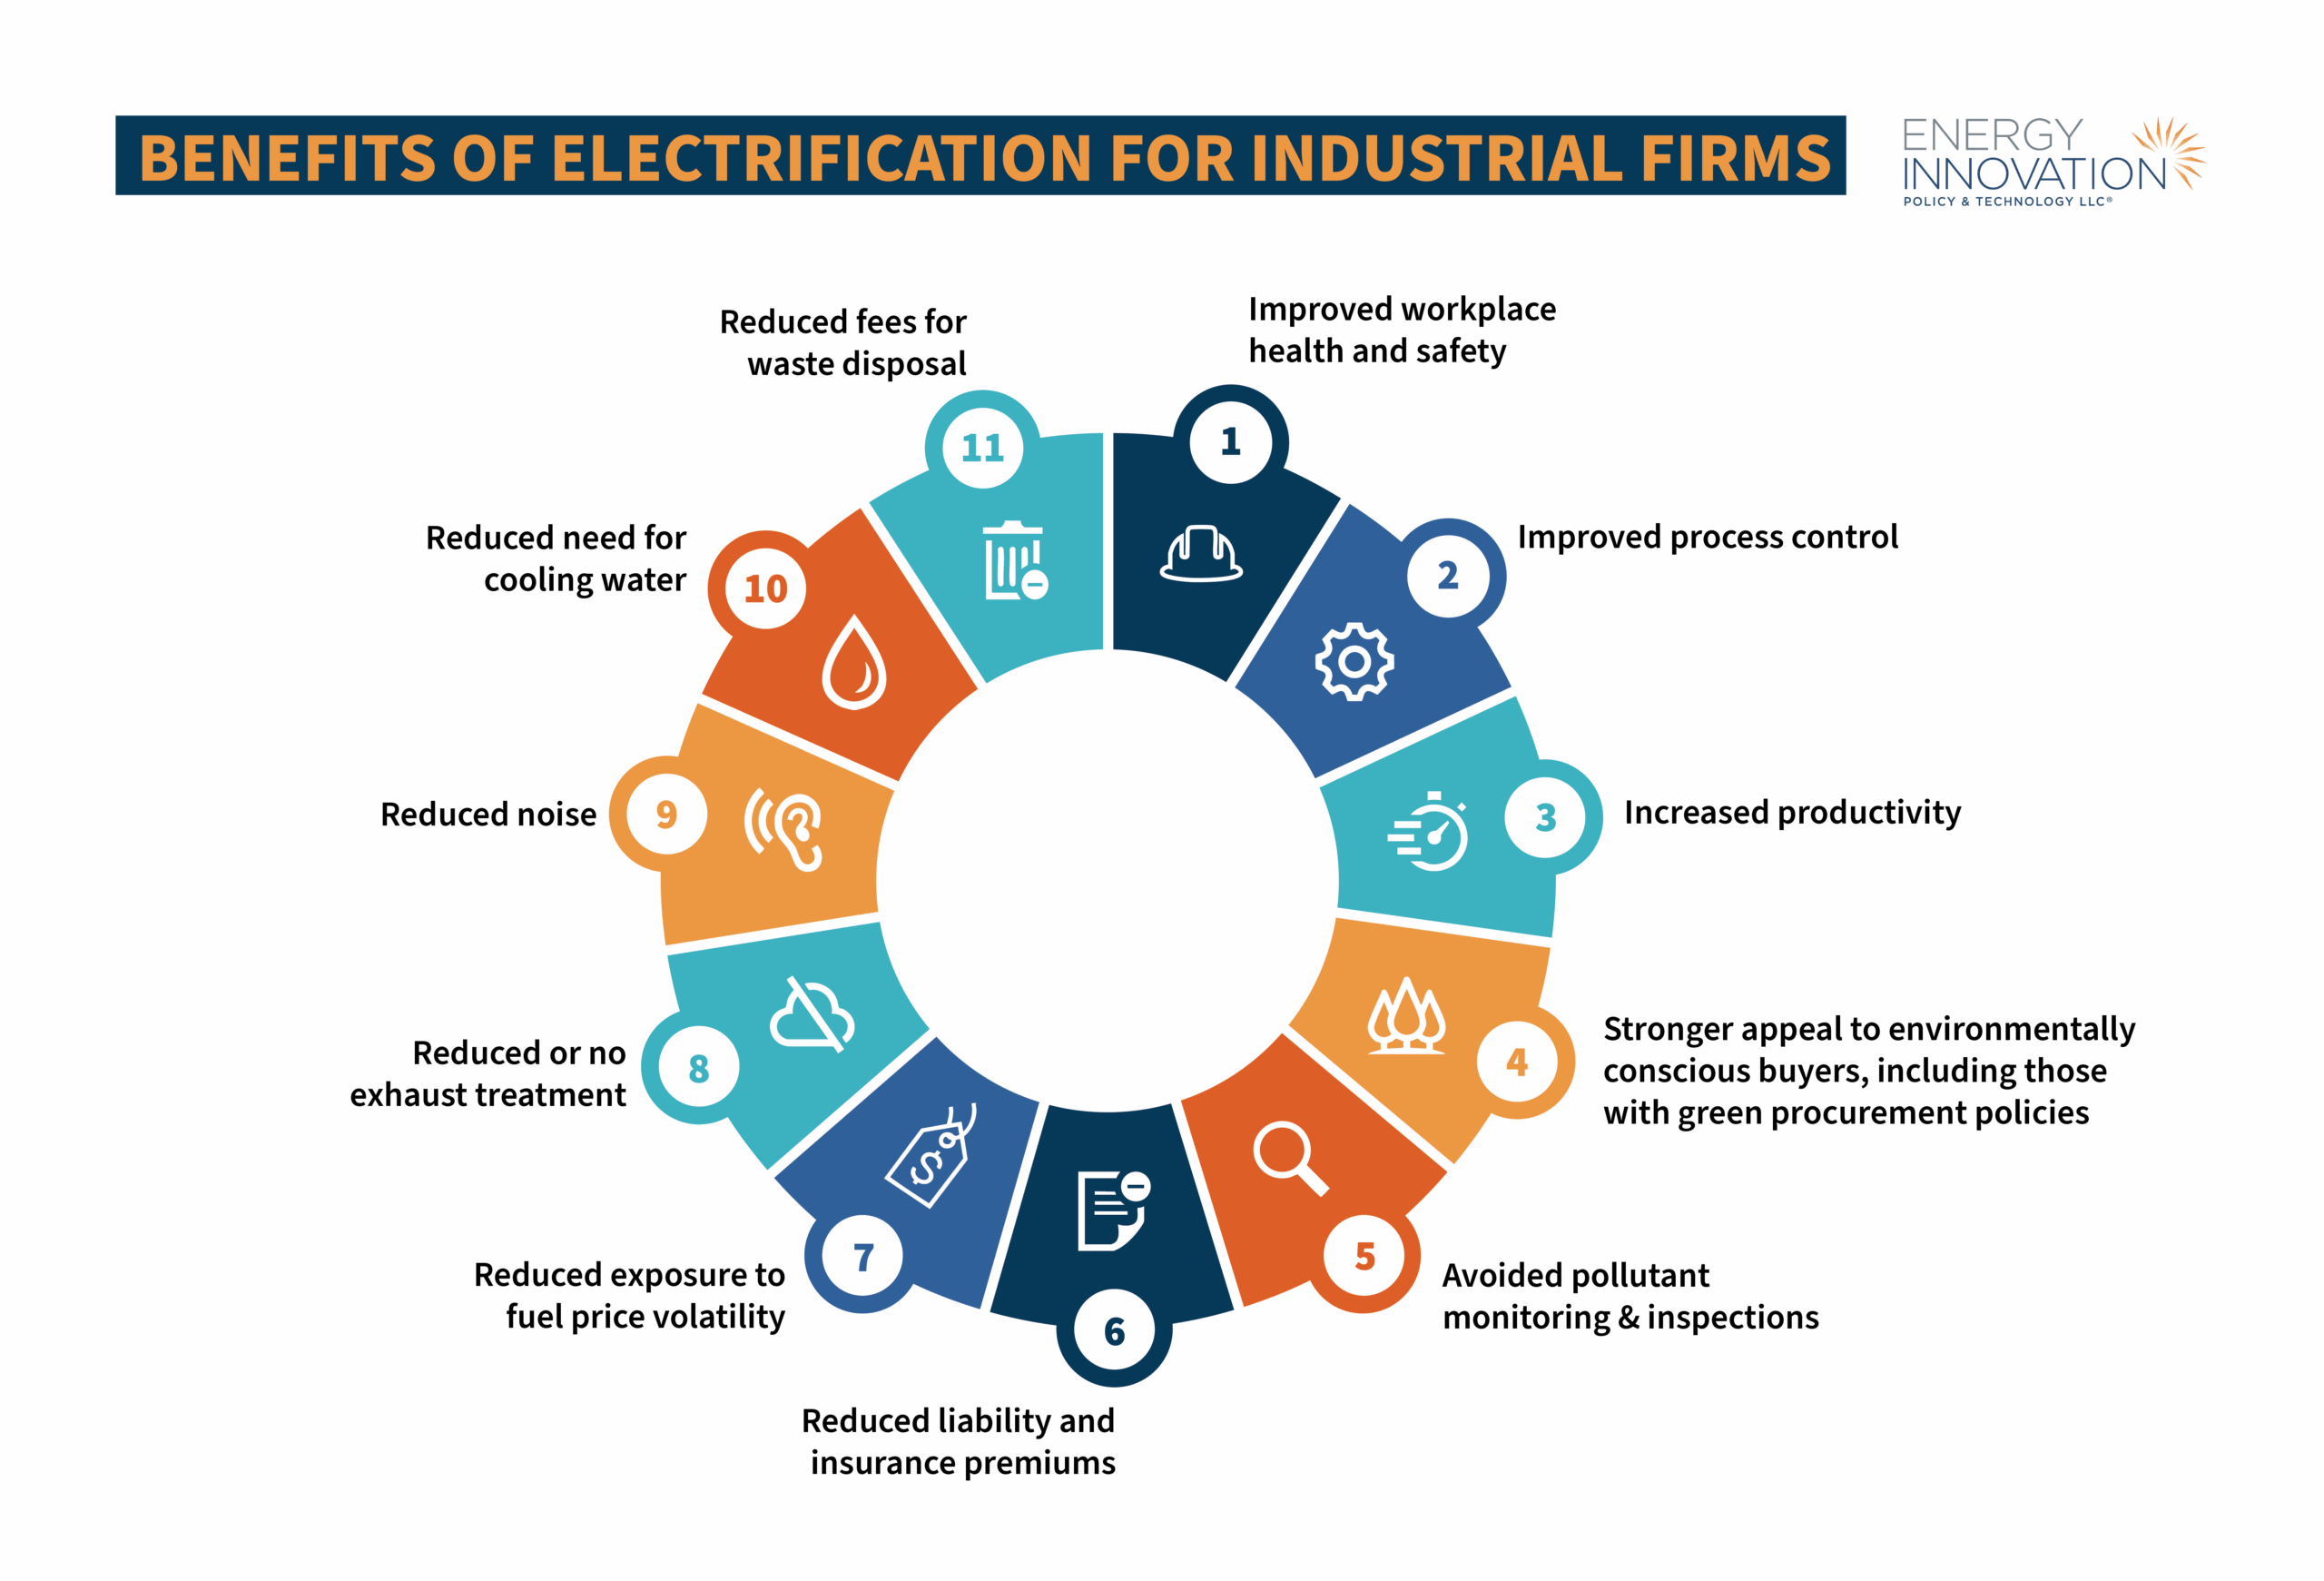
A safe climate requires clean industry, and businesses winning globally require clean products. Industrial electrification can do both.
data Explorer
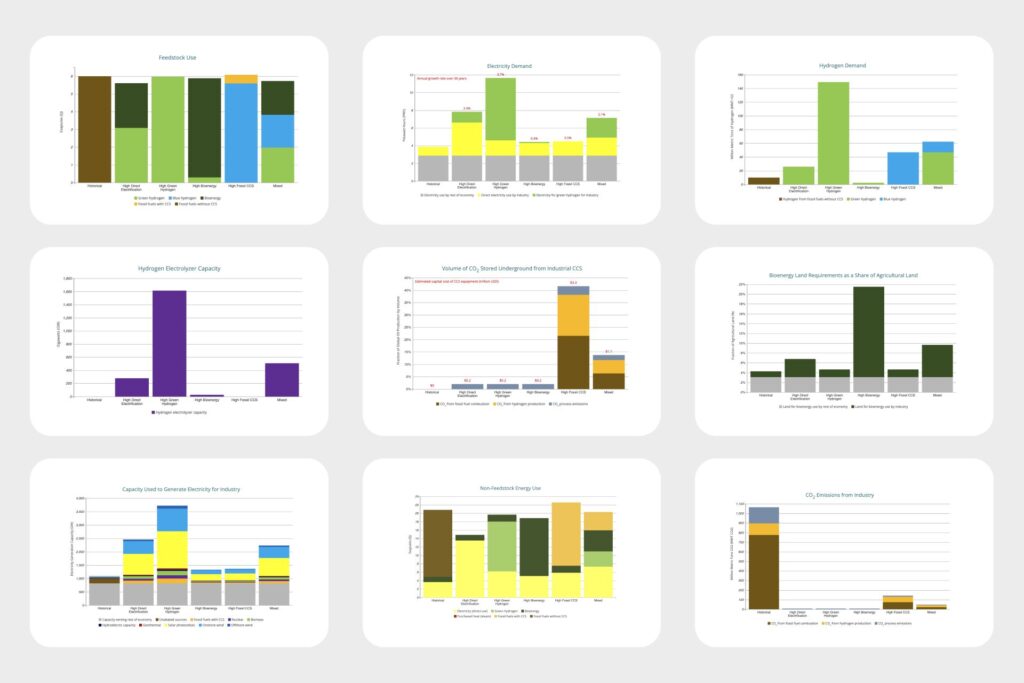
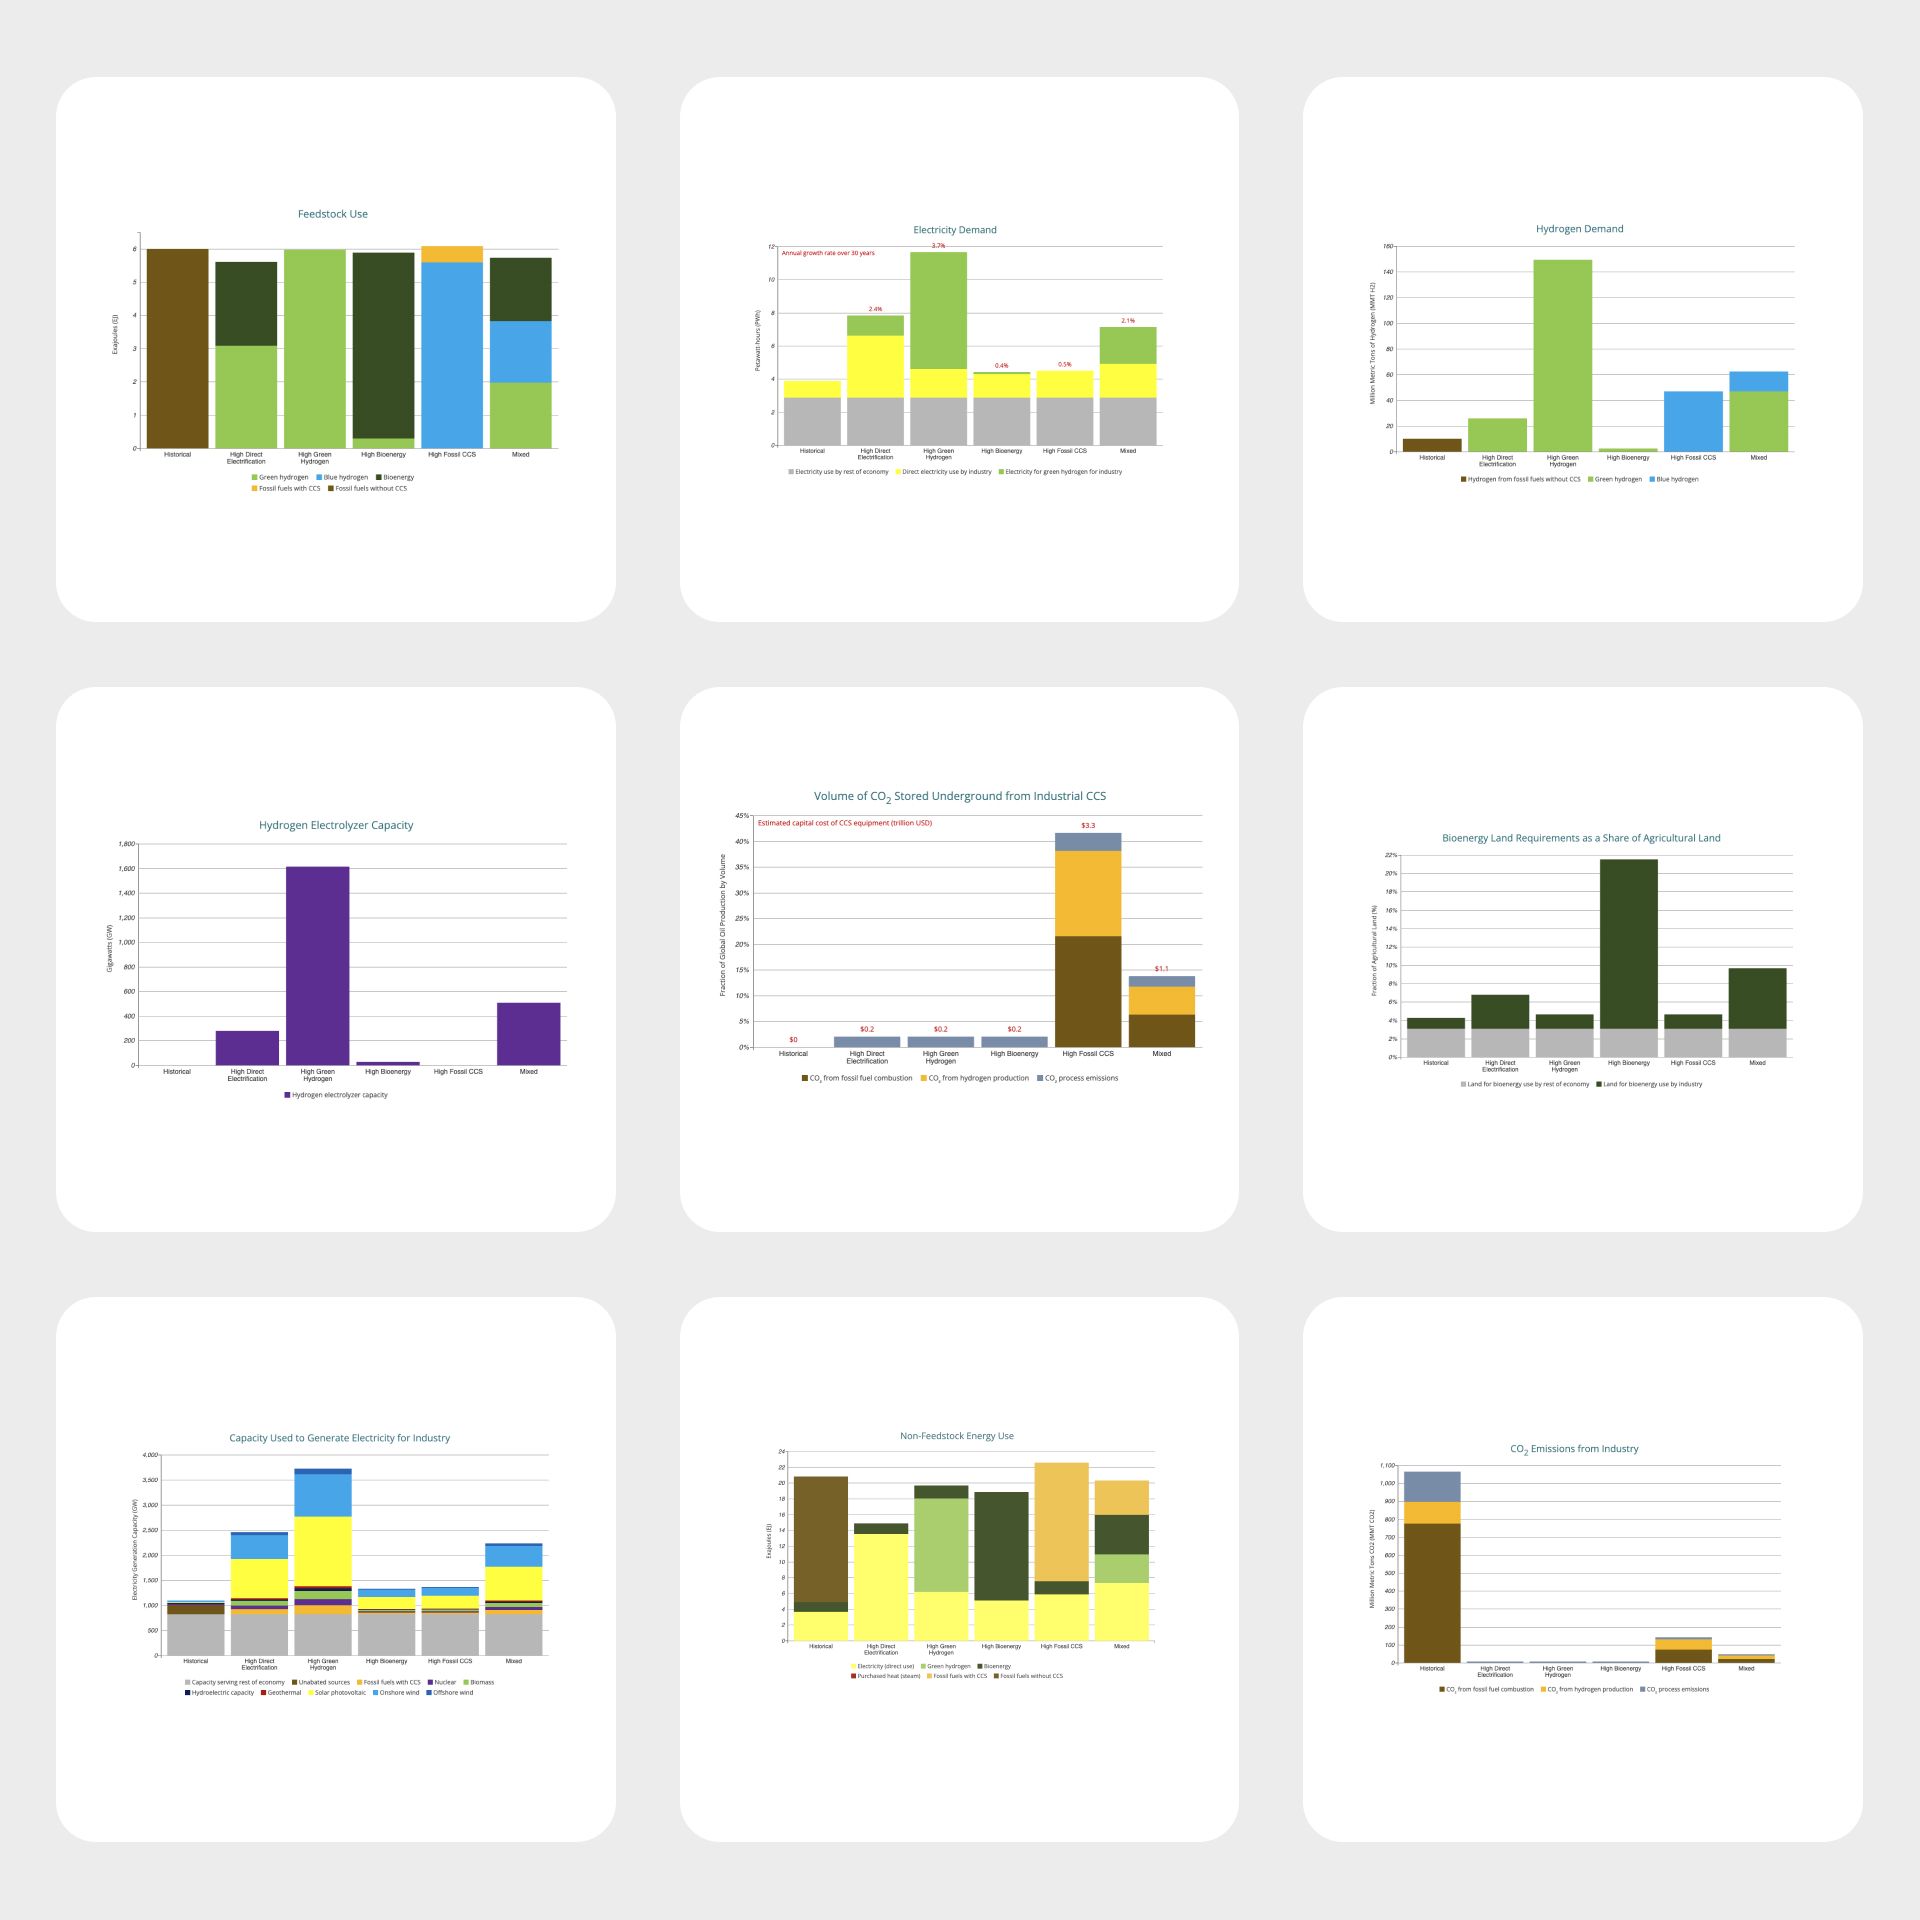
The Industrial Zero Emissions Calculator
The Industrial Zero Emissions Calculator tests strategies to cut industrial emissions and associated resource requirements.

Data Explorer
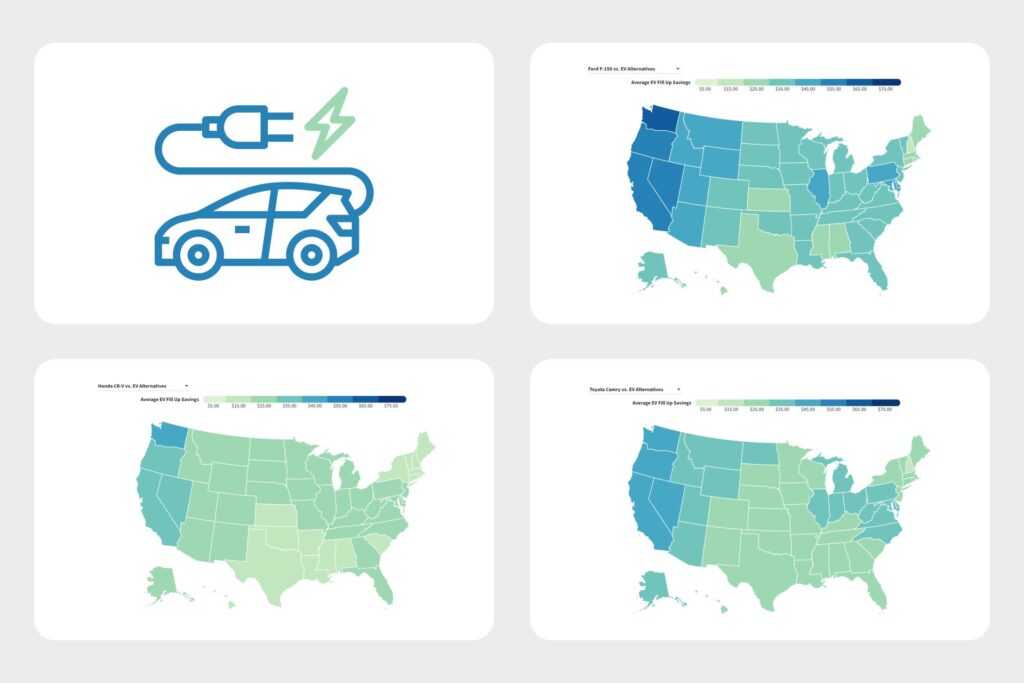
EV Fill Up Savings 2024 Update
Millions of electric vehicles hitting the road mean drivers must learn a new skill: determining how much it costs to charge their battery.
Stay Connected
Sign up for research, policy updates, and analysis.