**UPDATE: We have updated our levelized cost of energy graphs and analysis to include 2017 data and forecasts from the U.S. Energy Information Administration, Federal Energy Regulatory Commission, National Renewable Energy Laboratory, and Lazard in a new article Renewable Electricity Levelized Cost Of Energy Already Cheaper Than Fossil Fuels, And Prices Keep Plunging**
You can’t get too far in a discussion about the nation’s electric power sector without running into the question of costs. How do renewable sources, such as solar and wind, stack up against fossil fuels, such as coal and natural gas? How much will it cost utilities and ratepayers to build—and operate—a new power plant?
To illustrate how the various energy technologies compare, we’ve created a set of interactive dashboards that summarize how much it costs to generate power. The data show that utility-scale solar and wind installations are now competitive with conventional coal- and gas-fired power plants. Moreover, wind and solar costs are projected to steeply decline in the years ahead.
Before delving into the data, it’s worth noting that the number of dollars it takes to build and operate a power plant is a somewhat narrow definition of costs. It doesn’t, for example, include what economists call externalities, such as the cost of air pollution or climate change impacts. With a broader definition of costs, low-carbon technologies would perform even better than fossil fuels.
Components of levelized cost of energy
Our dashboards present data on what’s known as the levelized cost of energy. In essence, this analysis offers an apples-to-apples comparison of the costs of financing, building, operating, and maintaining a power plant. The values are expressed in dollars per megawatt-hour.
One of the most widely used levelized cost studies is conducted by Lazard, an international financial advisory and asset management firm. Their latest version of the study, version 8, was released in late 2014. The graphic below summarizes the cost components of 16 different energy technologies evaluated by Lazard: 10 of them are alternative (which includes mainly low-carbon, renewable technologies), and six are conventional (which includes fossil fuel sources and nuclear).
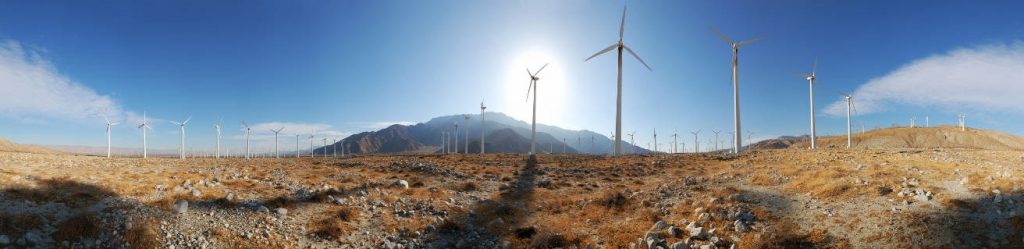
Onshore wind has the lowest average levelized cost in this analysis at $59 per megawatt-hour, and utility-scale photovoltaic plants weren’t far behind at $79. By comparison, the lowest cost conventional technologies were gas combined cycle technologies, averaging $74 per megawatt-hour, and coal plants, averaging $109. These numbers are the average of Lazard’s low- and high-end estimates (see their study for more about their cost calculations).
Looking across the 16 technology types, the 10 alternative technologies cost an average $147 per megawatt-hour, $18 less than the conventional approaches. “Certain Alternative Energy generation technologies,” Lazard wrote, “are cost-competitive with conventional generational technologies under some scenarios.”
By dividing the costs among capital, fuel, and operations and maintenance (O&M), you can see some dramatic differences among the technologies. Many renewable technologies, such as wind, solar, and geothermal, may not be cheap to build, but they have no fuel costs once they’re up and running, and generally have lower O&M costs as well.
Wind and solar costs falling
The levelized cost of some wind and solar technologies has plummeted in recent years. The graphic below shows that the average cost of onshore wind has fallen from $135 per megawatt-hour in 2009 to $59 in 2014. That’s a 56 percent drop in five years. The cost of utility-scale photovoltaic technology has plunged from $359 per megawatt-hour in 2009 to $79 in 2014, a 78 percent decline. Lazard attributes these falling costs to “material declines in the pricing of system components (e.g., panels, inverters, racking, turbines, etc.), and dramatic improvements in efficiency, among other factors.”
Other forms of solar power are expected to get even cheaper in the next few years. The graphic below shows that rooftop residential solar costs are expected to decline 42 percent between 2014 and 2017; for commercial and industrial photovoltaic installations, Lazard forecasts the levelized cost will drop 28 percent over the same period. “More efficient installation techniques, lower costs of capital and improved supply chains” are the driving forces behind these projected cost reductions.
Comparing the technologies
A variety of considerations—aside from cost—determine when, where, or how a technology is used. Although wind and solar are now cost-competitive and offer many health and environmental advantages over fossil fuels, these are still considered intermittent sources because the sun isn’t always shining and the wind isn’t always blowing). As a result, wind and solar are unable to entirely replace the services that certain conventional “baseload’” sources provide to the system. That said, utilities and power operators are discovering a multitude of new ways that low-carbon technologies can offer more value to the power grid across the board.
Transmission is another important issue, especially for power sources that are limited to certain areas, but it can also allow power plants to serve faraway customers.
Other resources
There are many other resources on the web for analyzing energy costs:
- The U.S. Energy Information Administration’s Annual Energy Outlook provides a different set of levelized cost figures for a variety of technologies.
- The National Renewable Energy Laboratory also offers an online calculator that lets you plug in variables, such as capital and fuel costs, to generate LCOE estimates.
- The Department of Energy’s OpenEI offers a Transparent Cost Database that compares the results from dozens of cost studies
To learn more about Energy Innovation’s work on clean energy, visit our power sector transformation and smart energy policy pages.