By Energy Innovation’s Modeling and Analysis Team
The free and open-source Energy Policy Simulator (EPS) computer model developed by Energy Innovation has become one of the most widely used tools to inform policymakers and regulators about which climate and energy policies will reduce greenhouse gas emissions most effectively while creating the largest economic and public health benefits.
With EPS models now available for dozens of countries and subnational areas, including 48 U.S. states, we’re often asked how the EPS works and what peer review it has undergone through its development.
The EPS is a System Dynamics computer model created in Vensim, a tool produced by Ventana Systems for the creation and simulation of System Dynamics models. The model can be run via the free Vensim Model Reader or through a web interface Energy Innovation developed. Directions on obtaining Vensim Model Reader and the EPS are available on the Download and Installation page and users can access the model online via the energypolicy.solutions website.
Users can access advanced features or modify input data by downloading the EPS and running it locally on their Mac or Windows PC. All input data is meticulously cited, publicly available, and freely accessible and editable. Users can run the model in Vensim Model Reader and instantly see how changes in input assumptions change the model’s outputs.
The EPS is an economy-wide, single region model that runs in annual time steps. It can be configured to run to 2100, though it is most often configured to run to 2050. The EPS includes bottom-up stock turnover tracking in several sectors and a profit-maximizing least-cost optimized electricity model, including 24 hours across six different time slices. It also has local cost minimization for certain sectors and technologies, for example it selects the lowest cost mix of new vehicles sold in a given year based on demand for new vehicles.
The EPS is designed to model dozens of policies affecting energy use and emissions. The model first builds a business-as-usual case based on input data and current policies. From there, the EPS allows users to model any combination of included policies and to customize the policy stringency and timelines of those policies. These policies include, for example:
- Renewable portfolio standards or clean energy standards
- Fuel economy standards for vehicles
- Zero emissions vehicle standards and incentives
- Industry methane standards
- Incentives for clean energy technologies like those in the Inflation Reduction Act
- Accelerated R&D advancement of various technologies
The EPS features an embedded downstream input-output model that translates changes in spending from policy to changes in economic outcomes, such as jobs, GDP, and worker wages. Changes in demand for services and goods that result from macroeconomic changes are fed back into the model on a one-year time delay, allowing the model to adjust energy demand and emissions based on the economy’s evolution.
The EPS also includes a simplified downstream health module that translates changes in health-damaging pollutants into changes in health outcomes. The health module relies on benefit-per-ton estimates from U.S. Environmental Protection Agency modeling and follows standard practices for converting changes in emissions to changes in health outcomes.
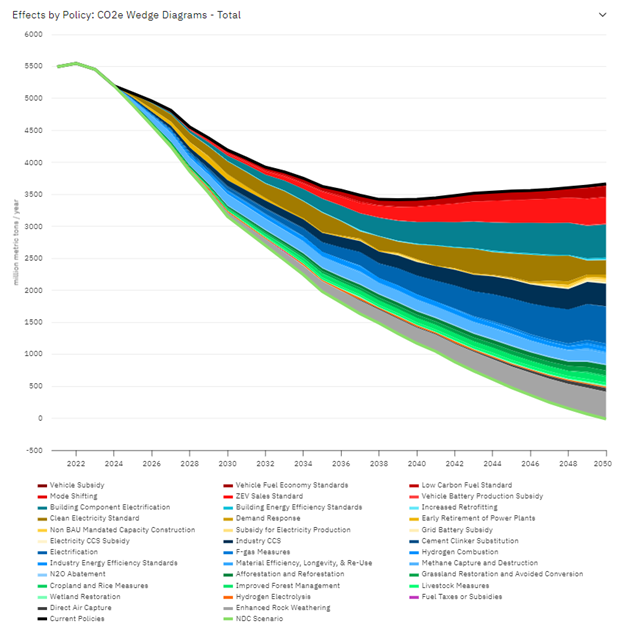
Energy Policy Simulator U.S. NDC policy package effects CO2e wedge diagram
Thousands of outputs are available in the model, but some key metrics include:
- Emissions of 12 different pollutants including carbon dioxide, methane, N2O, fluorinated gases, NOx, SOx, PM2.5, PM10, black carbon, organic carbon, carbon monoxide and volatile organic compounds.
- Changes in spending on capital, fuel, maintenance, taxes and subsidies.
- Direct, indirect, and induced impacts on jobs, GDP, and employee compensation as a whole or disaggregated into 42 sectors.
- Premature mortality and 10 other avoided health-related outcomes from reduced primary and secondary particulate pollution.
- Detailed electricity sector information including hourly demand and supply, generation, capacity, and retail electricity rates.
- Sales and stock of different vehicles and vehicle technologies, such as battery electric, plug-in hybrid electric, hydrogen fuel cell, and gas-powered vehicles.
- Energy used by different services and technologies across the economy, broken down by fuel type
- Breakdowns of how each policy within a policy package contributes to total abatement and the cost-effectiveness of each policy (e.g., wedge diagrams and cost curves).
- Fuel imports and exports, and associated expenditures or revenues.
- Detailed accounting of energy used by 25 different industry sectors, including construction and agriculture, end use (e.g., boiler, low/medium/high temperature heat, machine drive) and fuel type.
Core methodologies and structures in the EPS have undergone extensive peer review as they were developed, and we continually seek input from outside experts to modify the methodologies and address concerns that are raised. Components of the model have been reviewed by individuals from prestigious institutions including:
- American Council for an Energy-Efficient Economy
- Argonne National Laboratory
- Lawrence Berkeley National Laboratory
- Massachusetts Institute of Technology
- National Renewable Energy Laboratory
- RMI
- Stanford University
- Tufts University
- University of Chicago
- U.S. Environmental Protection Agency
- World Resources Institute

National labs, universities, and partners who have peer reviewed the Energy Policy Simulator