Energy Innovation partners with the independent nonprofit Aspen Global Change Institute (AGCI) to provide climate and energy research updates. The research synopsis below comes from AGCI’s Emily Jack-Scott and Liz Carver. A full list of AGCI’s updates is available online.

Winter is coming, and people across the country have started turning on their heat to take the edge off the cold. With clear memories of last winter’s high heating costs and this season’s prices predicted to remain at near-record levels, many are resisting as long as possible before finally flipping the switch on their thermostats.
The impacts on both psychological and physical health and the economic toll of insufficient heat in winter is staggering and leaves an intergenerational wake. Household members, especially children and the elderly, suffer more from poor health (including an uptick in respiratory illnesses), have higher rates of anxiety and depression, and incur more trips to the hospital. Children are more likely to exhibit rule-breaking behaviors, such as skipping school. Physical and financial stress compound, and domestic disturbances and abuse rise. And the most extreme cases of energy insecurity result in injury or death due to unsafe temperatures or from using ovens or stoves as primary or secondary heat sources.
The energy transition from fossil fuels to renewable energy presents a critical opportunity to rectify this energy injustice. But to realize that potential, recent research calls upon policymakers to pay attention to important gaps in the ways heating energy burden and poverty are measured, and how policy prescriptions can be designed and implemented to address energy burden inequities, lest they inadvertently exacerbate energy insecurity in the transition.
Who is impacted by home energy poverty?
An uptick in research over the last decade has confirmed what many households have known for decades: low-income households pay a much higher percentage of their income on heating costs than higher-income households.
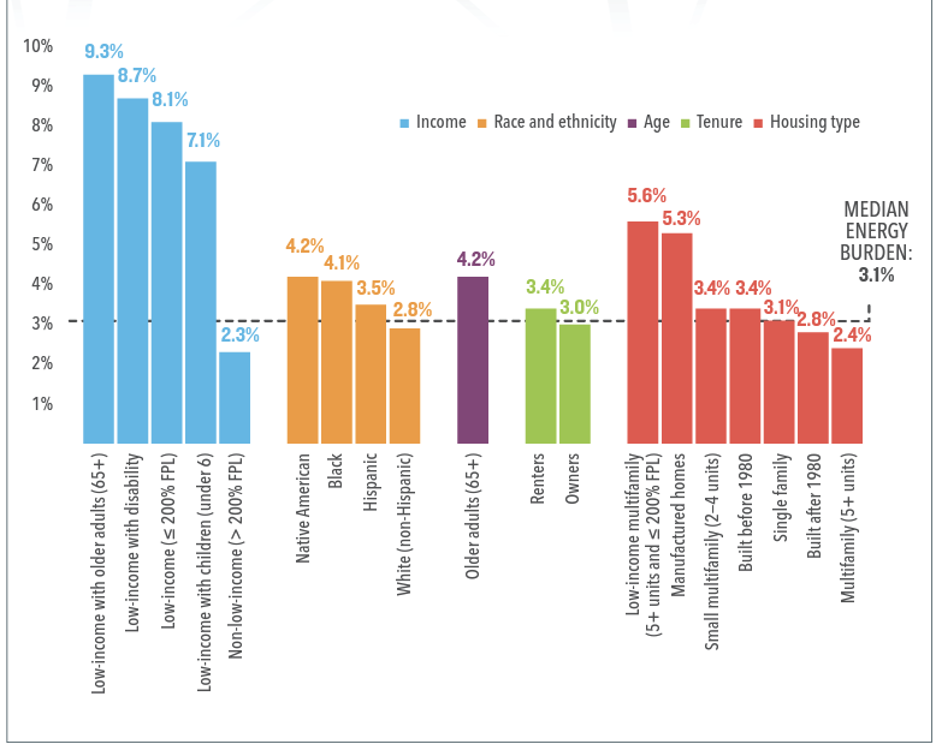
The energy burden of heating and cooling is often based on the percentage of a household’s income spent on energy. Many assistance programs categorize energy burdens as low (<6 percent income), high (>6 percent), and severe (>10 percent), as defined by a 2020 report published by the American Council for an Energy-Efficient Economy (ACEEE). According to the report, 12 percent of the U.S. population spent between 6 and 10 percent of their income on energy, and a whopping 13 percent of the population spent more than 10 percent of their income on energy (which constitutes a “severe energy burden”)—that’s nearly 16 million people in this the U.S. paying over a tenth of their limited income on energy costs.
The report also illustrates the disproportionate distribution of energy burden by income level, race and ethnicity, age, and housing type. Inequities in energy burden are shouldered by low-income households (even more pronounced among low-income seniors and those with disabilities); Native American, Black, and Hispanic households; renters; and low-income multifamily housing units and manufactured homes (both of which have notoriously poor weatherization) (Figure 2).
Historical policies and social context strongly influence today’s distribution of energy poverty. Redlining policies that limited mortgages for communities of color, especially Black Americans, have a lasting legacy evidenced in today’s heating inequities. In a 2022 paper in Energy Research and Social Science led by Benjamin Goldstein, the authors examined household energy usage intensity and carbon emissions against household race and historical policies.
They found that energy use intensity is significantly higher in historically redlined districts, which are still predominantly African American neighborhoods. African Americans are also more likely to be renters than homeowners and are more likely to be in energy-inefficient housing. There have been very few incentives for landlords to invest in efficiency or weatherization programs, since the utility cost for heating and cooling is usually the responsibility of renters (what is frequently referred to as the “split-incentive” problem).
How energy poverty is measured
So how can we ensure the accountability of policies and programs aimed at reducing energy poverty and addressing these inequities?
Another recent paper published in Energy Policy, led by author Luling Huang, points to the critical need to more accurately quantify levels of energy poverty. Traditional approaches to assessing energy poverty have largely fallen into two buckets: 1) asking consumers to self-assess the financial burden of heating and cooling their homes, or 2) using indicators or proxies such as how much energy is consumed, how much consumers spend on energy, building energy efficiency, and household income.
But as Huang’s findings confirm, both of these approaches fail to adequately capture the extent to which households limit their heating energy usage in order to reduce costs. Huang and colleagues measured heating and cooling usage in direct response to temperature changes, and analyzed consumption patterns against census income data to assess inequities. They found that a significant percentage of households exhibited dangerous levels of “energy limiting behavior” each year, but were not being captured by traditional metrics.
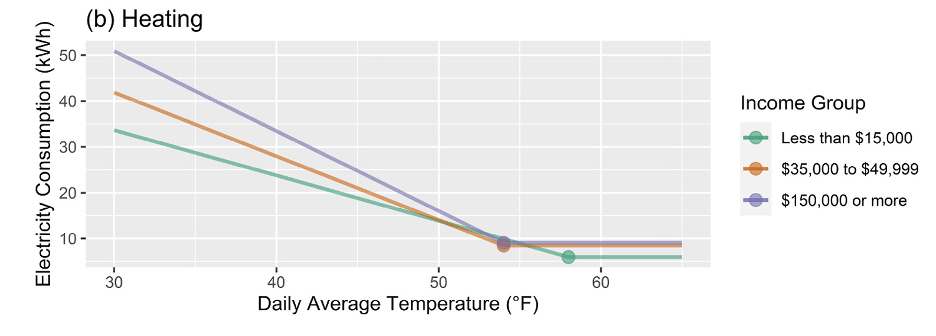
Huang and colleagues found low-income households frequently turn on heating units earlier in the winter than their higher-income counterparts (Figure 3). While this may seem counter to the assumption that low-income households are more apt to limit their heating due to financial constraints, the authors point to the substandard insulation and efficiency of many affordable housing options, which necessitate earlier and longer winter heating periods, as the likely cause.
Despite the poor building efficiency of many low-income homes, consumers actually use significantly less energy per square foot throughout the heating season compared to high-income homes, which consume 52 percent more heat per square foot annually. Furthermore (and despite significant energy-limiting behaviors), low-income households consistently end up shouldering “high” and “severe” energy burdens (spending between 6 percent and 10 percent, or more than 10 percent, of their income on energy, respectively) throughout the heating season (Figure 4).
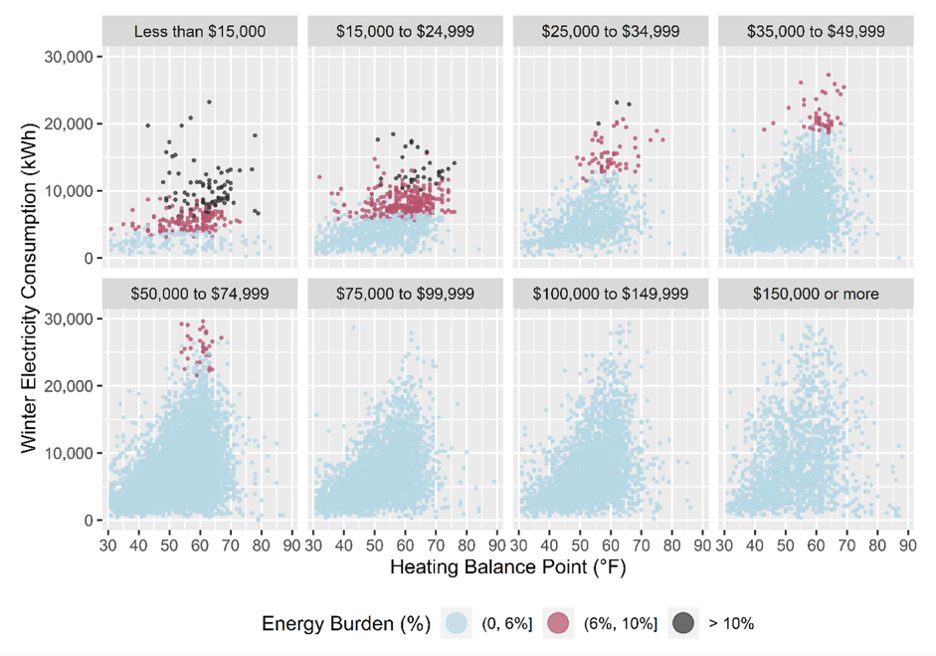
In Figure 4, the “heating balance point” on the x-axis indicates the outdoor temperature at which households were compelled to turn on heating units throughout winter. Note the significant number of households (each dot) that have heating units on when the outside temperature is in the 30s and 40s, but are consuming very little electricity (y-axis). When a household is in this situation, they are clearly rationing heating electricity and suffering the psychological, health, and socio-economic impacts of insufficient heating.
Huang and colleagues calculated the percentage of the study households living in these conditions totaled a whopping 24 percent of the study population, the majority of whom would not have been captured by traditional energy burden metrics. Because these households had so severely limited their electricity consumption, their costs wouldn’t have exceeded the traditional threshold of “low energy burden” (less than 6 percent income spent on energy).
What are U.S. policymakers doing to try to reduce energy poverty in the transition to renewable energy?
These nuances in who endures energy poverty and how that burden is tracked are critical for improving existing policies and creating new policies that seek to reduce both energy insecurity and carbon emissions.
For instance, both Huang and Goldstein spotlight hidden energy burdens, which could be used to broaden eligibility requirements for existing assistance programs like the Low-Income Home Energy Assistance Program (LIHEAP), or the Weatherization Assistance Program (WAP). LIHEAP is a federal- and state-funded effort to provide assistance for home energy bills, and WAP can provide whole-house weatherization resources for low-income households, but eligibility for both is currently based on income level. The same is true for many state-funded energy assistance programs.
Huang and colleagues encourage policymakers to go beyond using household income as the only eligibility criteria for assistance programs, since this can result in the oversight of compounding factors of housing type, race, and the nuances of financial stress, regardless of income. Huang suggests installing and using smart meters to properly monitor heating burden and insecurity within households. Energy assistance programs can then receive alerts when energy limiting behaviors reach levels of concern, and better tailor their support to vulnerable households.
The landmark Inflation Reduction Act (IRA) of 2022 includes $391 billion for a variety of programs, incentives, and tax credits to accelerate a clean energy transition, decarbonize the economy, and mitigate climate change. Several of these programs can help reduce energy poverty by making energy-efficient home upgrades and renewable energy adoption more accessible to low- and middle-income families.
As Goldstein and colleagues underscore in their paper, one of the biggest barriers for the communities most affected by energy insecurity is limited availability of upfront capital to invest in energy-saving upgrades or renewable installations, and insufficient tax liability to benefit from tax credit incentives. Policies that decrease upfront costs through direct consumer incentives, such as instant rebates, are especially helpful.
In response to this need, the IRA allocated nearly $9 billion for states and Tribes to design and implement two Home Energy Rebate Programs to accelerate the adoption of residential energy efficiency and renewable energy systems. The Home Efficiency Rebates program provides instant rebates to homeowners and landlords of single- and multi-family homes for performance-based, whole-home energy efficiency and electrification upgrades, without income restrictions.
The Home Electrification and Appliance Rebates program provides direct rebates of up to 100 percent to help low- and middle-income households purchase and install energy-efficient electric appliances, such as heat pumps, water heaters, and stoves. Huang and colleagues specifically point to the IRA’s rebate programs as “a major step forward to help households (especially low-to-middle-income households) to improve energy efficiency at home.”
Beyond the direct rebate programs, the IRA allocates $3 billion for Environmental and Climate Justice Block Grants, which can be used to fund community-led projects in historically underserved communities, including initiatives to reduce energy costs through renewable energy or energy efficiency. Another IRA program provides $1 billion in funding to increase energy efficiency in affordable housing.
As these new programs are rolled out, it is critically important to ensure that they truly benefit energy insecure households. Policymakers at the metro, state, and federal levels will need to hold landlords accountable to make sure that subsidized energy efficiency and renewable energy improvements don’t result in “renovictions,” as energy upgrade costs are passed along to renters, making rents unaffordable. Goldstein points to possible solutions, such as allowing tenants (and landlords) to pay for retrofits through monthly utility payments (as long as energy savings outweigh improvement costs), or providing compensation to landlords dependent on renewal of leases with prior tenants at comparable rates when renovations have been completed.
Energy burden, insecurity measurements of household income spent on energy expenses, and energy limiting behaviors must also be closely monitored to ensure that weatherization, efficiency, and renewable energy projects effectively reduce energy insecurity for vulnerable communities.
Goldstein et al. and Huang et al. both point to the need to expand investment at the federal and state levels to mitigate the impacts and drivers of energy poverty. In addition to assistance programs, Huang and colleagues point to the need for general investment in infrastructure and jobs to address the root of inequitable energy burdens and improve everyday living conditions.
Featured research:
Drehobl, A., Ross, L. and Ayala, R., 2020. How high are household energy burdens. An Assessment of National and Metropolitan Energy Burdens across the US.
Goldstein, B., Reames, T.G. and Newell, J.P., 2022. Racial inequity in household energy efficiency and carbon emissions in the United States: An emissions paradox. Energy Research & Social Science, 84, p.102365.
Huang, L., Nock, D., Cong, S. and Qiu, Y.L., 2023. Inequalities across cooling and heating in households: Energy equity gaps. Energy Policy, 182, p.113748.