By Megan Mahajan and Jeffrey Rissman
This week, Energy Innovation launched a significant model update to the United States Energy Policy Simulator (EPS), our open-source, peer-reviewed, and nonpartisan model that estimates the environmental, economic, and health impacts of hundreds of climate and energy policies.
This update is timely. As the nation works to spur economic recovery from the COVID-19 recession, clean energy investment is a clear opportunity to generate new jobs while paving the way for a safe and livable climate future. The EPS already provided detailed outputs on emissions and changes in cash flows, among many other metrics.
But with the recent update to version 3.0, the EPS now reports how policies will affect gross domestic product (GDP), jobs, and employee compensation – offering valuable insights for policymakers and others interested in opportunities to reduce pollution while boosting the economy.
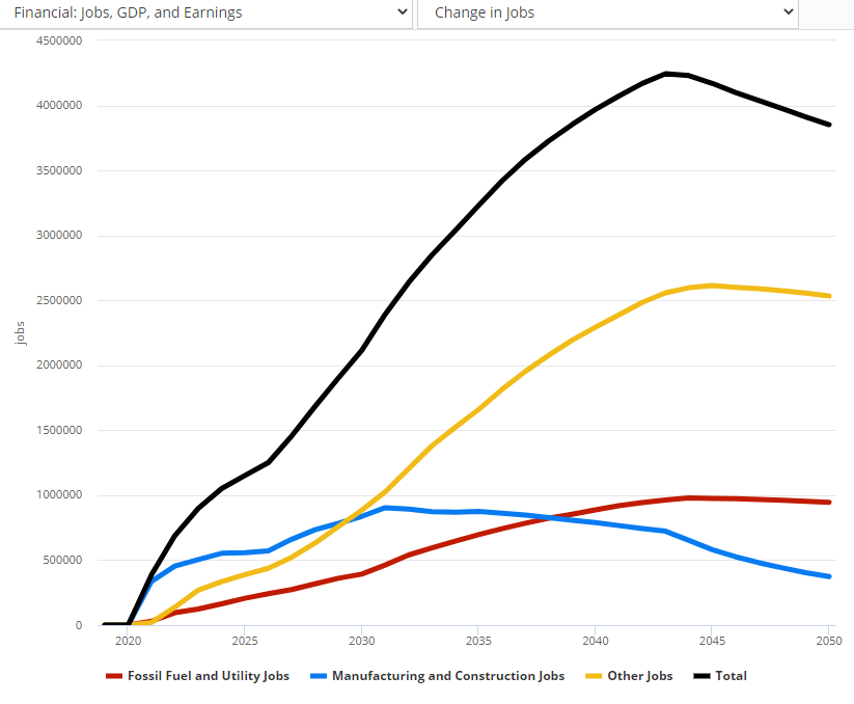
Change in jobs in a net-zero scenario
Input-Output Model
The largest new feature in EPS version 3.0 is a fully integrated macroeconomic input-output model (documentation available here). Prior to 3.0, the EPS only tracked direct, first-order changes in cash flows (e.g., costs or savings for government, industry, labor, and consumers). It could not evaluate GDP or employment changes, because those metrics strongly depend on how recipients of first-order cash flow changes use those savings or make up the shortfall if they have higher costs. As of version 3.0, however, the EPS is able to more thoroughly track indirect and induced economic impacts, producing detailed financial and employment outputs including policy impacts on GDP, jobs, and total and average employee compensation.
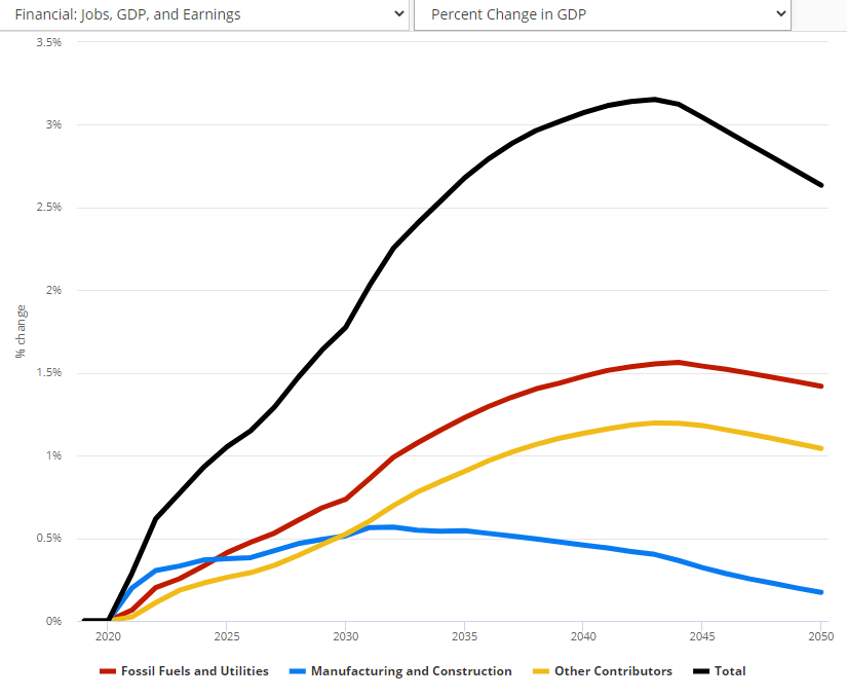
Percent GDP change in a net-zero scenario
The new input-output model is built using data from the Organisation for Economic Co-operation and Development (OECD) Statistical Database, which breaks up actors in the economy by International Standard Industrial Classification (ISIC) codes that represent economic activity. The OECD tables detail how each actor supplies and/or purchases inputs from other actors; as well as employment, value added, employee compensation, and economic output. When mapped onto entities tracked in the EPS and paired with the model’s existing calculations for direct economic impacts (changes to first-order cash flows in response to selected policies), the new OECD data allow the EPS to account for changes in inputs purchased by different industries and how additional output ripples through the economy.
The EPS tracks the supply of domestic versus foreign goods, so it can accurately report domestic changes in GDP and jobs. It also incorporates feedback loops in the transportation, buildings, and industry sectors to capture energy use and emissions effects of indirect and induced economic impacts. The EPS also incorporates data on the percentage of jobs represented by unions in order to estimate changes in union and non-union jobs.
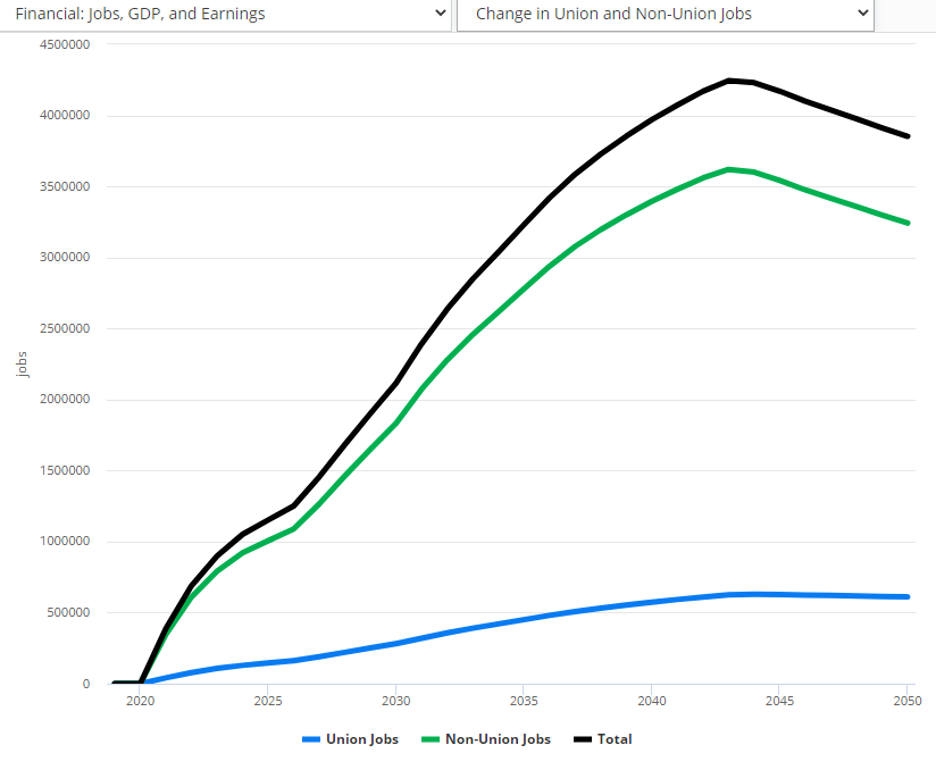
Change in union and non-union jobs in a net-zero scenario
The EPS also adds new options for handling government revenue, and calculates policy impacts on government spending, budget deficit (or surplus), household taxes (or climate dividend payments), payroll taxes, corporate income taxes, the national debt, and interest payments on the national debt. Government revenue handling settings can be customized for each tax or subsidy policy, as well as for national debt interest and for any remaining impacts on government budget, allowing the simulation of policy packages containing detailed, heterogeneous mixtures of choices for how government raises or spends revenue.
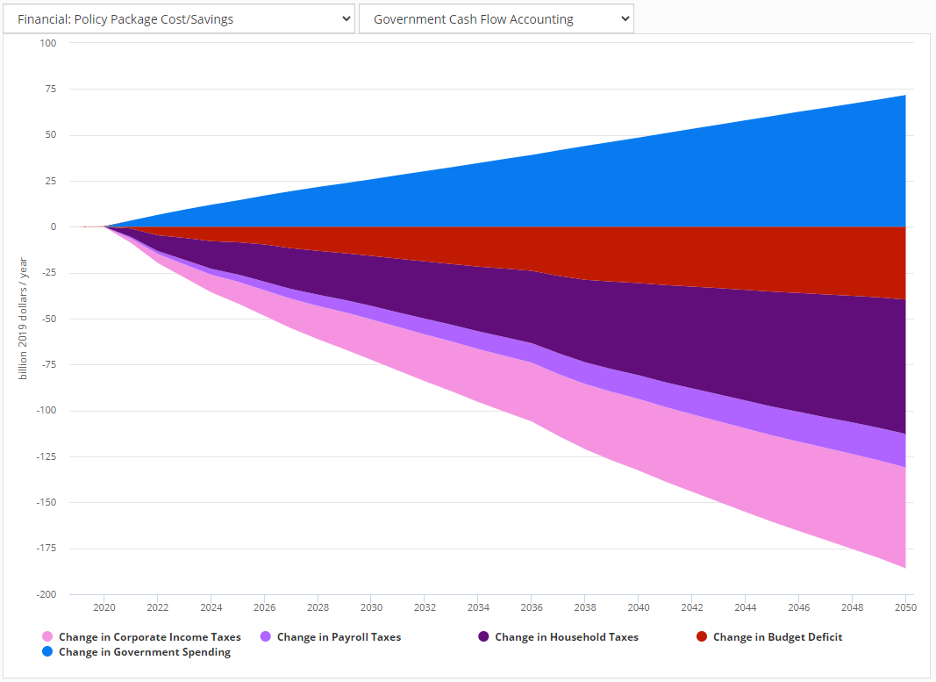
Change in government cash flow in an example scenario
These updates come when many policymakers and advocates are pointing to clean energy investments as a significant opportunity to reinvigorate the economy while meeting climate goals. These recent updates mean the EPS offers users unparalleled capabilities to build individual policy packages and examine their impacts on emissions, as well as economic and employment metrics.
We gratefully acknowledge the invaluable contributions of the American Council for an Energy-Efficient Economy, Jim Barrett, and Skip Laitner for their guidance and advice in implementing this feature, and for allowing us to learn from the DEEPER I/O model, originally created by Skip Laitner.
Other New Model Features
The EPS 3.0 also incorporates new data and several important improvements, such as updated U.S. Environmental Protection Agency data on public health impacts per ton of pollutant. Whereas the EPS previously reported only avoided premature mortalities, public health outputs now also include ten additional health outcomes including lost workdays, hospital admissions, non-fatal heart attacks, and asthma attacks. The EPS 3.0 also adds a wedge diagram showing how enabled policies contribute to avoided premature mortalities. We continue to report monetized health benefits, in addition to monetized climate benefits, to capture a policy package’s social benefits.
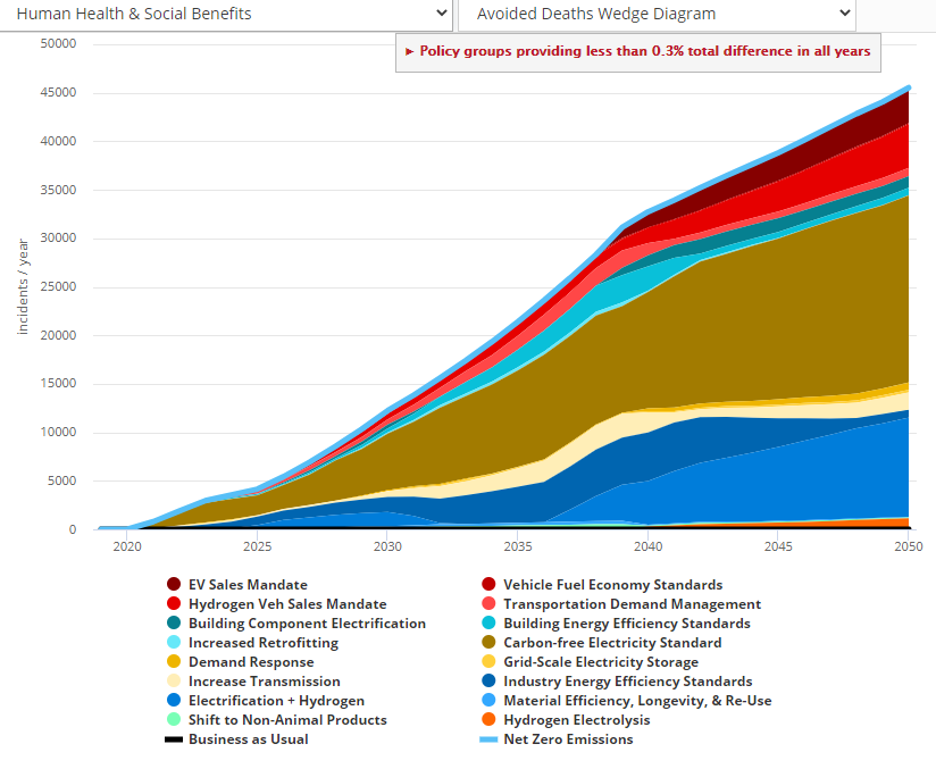
Changes in avoided deaths under net-zero scenario
As of EPS 3.0, the online interface includes the option to display nearly 150 different output graphs, allowing users to explore the impacts of their selected policies in great detail. For example, new graphs display the embedded carbon dioxide in exported fuels to allow for a more complete accounting of emissions impacts of economic activity within the modeled region.
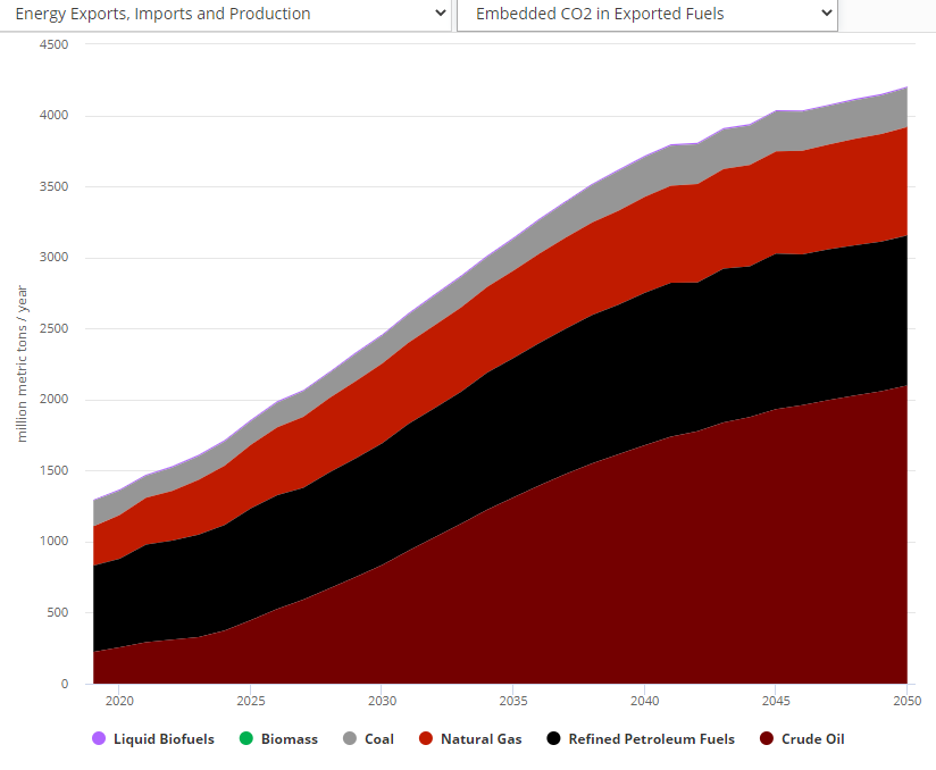
Changes in embedded carbon dioxide under net-zero scenario
The update also includes new structural capabilities, including the ability to track changes to peak power demand as a result of electrification – an especially important feature in deep decarbonization policy scenarios such as our example Net Zero Scenario displayed on the model’s online interface. EPS 3.0 also updated to the latest data sources in many files, e.g. the U.S. Energy Information Administration’s Annual Energy Outlook 2020 and the National Renewable Energy Laboratory’s Annual Technology Baseline 2020.
Users can explore the entire list of updates on our Version History Page, as well as test the new outputs and features and build their own policy scenarios at https://www.energypolicy.solutions/.