Energy Innovation partners with the independent nonprofit Aspen Global Change Institute (AGCI) to provide climate and energy research updates. The research synopsis below comes from AGCI Executive Director James Arnott. A full list of AGCI’s quarterly research updates covering recent climate change research on clean energy pathways is available online at https://www.agci.org/solutions/quarterly-research-reviews.
Deep decarbonization demands we do something that has never been done before: deliberately transform the energy foundation of the global economy in mere decades. How quickly we accomplish this novel task will critically depend on how fast we learn in the process.
The value of learning, in one sense, has long been incorporated into studies of innovation. “Learning curves,” for instance, relate changes in costs to changes in production as industries mature. Perhaps the most famous learning curve—later dubbed “Moore’s Law”—was identified in 1965 by Intel’s Gordon Moore, who accurately predicted that the number of transistors within a semiconductor would double every two years as producers gained more experience.
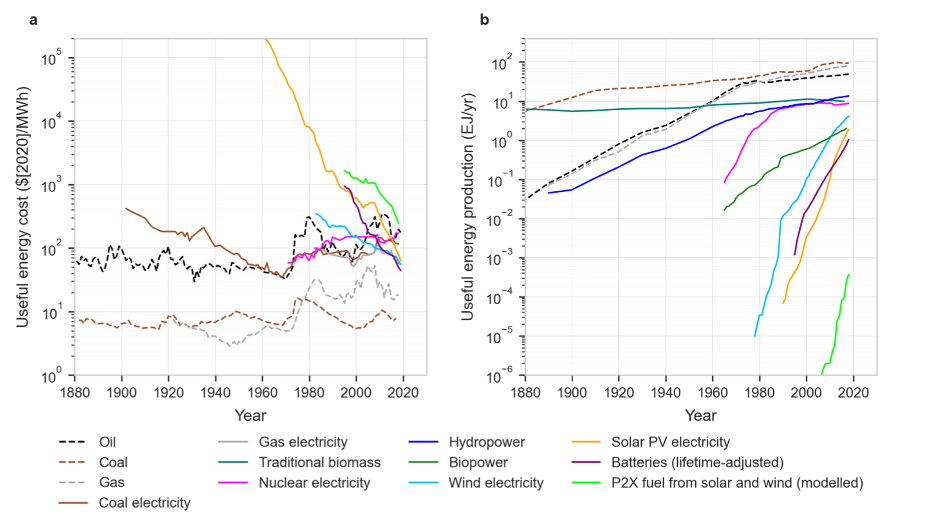
More recently, learning curves have been enthusiastically referenced to explain staggering declines in costs of key climate technologies like solar photovoltaics (PV) and batteries (see Figure 1). Although this rate of progress was difficult to foresee even a decade ago, in hindsight it grounds hopes that we can get where we need to go—as long as we don’t delay getting started.
Right now, an entirely different—but quite complementary—notion of learning is emerging from the field of artificial intelligence, where the technique of machine learning (ML) is maturing rapidly. ML tasks computers, rather than humans, with identifying meaningful patterns and making predictions within large datasets. ML is beginning to provide crucial support in navigating the growing and complex data entailed in managing a clean energy transition.
New research shows how learning, by humans together with machines, can grease the skids of a clean energy transition. Here are some highlights.
Sustained learning accelerates decarbonization
How fast could decarbonization occur if the recently steep rates of cost reductions and deployments shown in Figure 1 were simply sustained? Last year, a team at Oxford’s Institute for New Economic Thinking explored this question in a working paper by using historical data on cost and deployment trends for numerous climate technologies to generate projections of future energy costs and deployment rates.
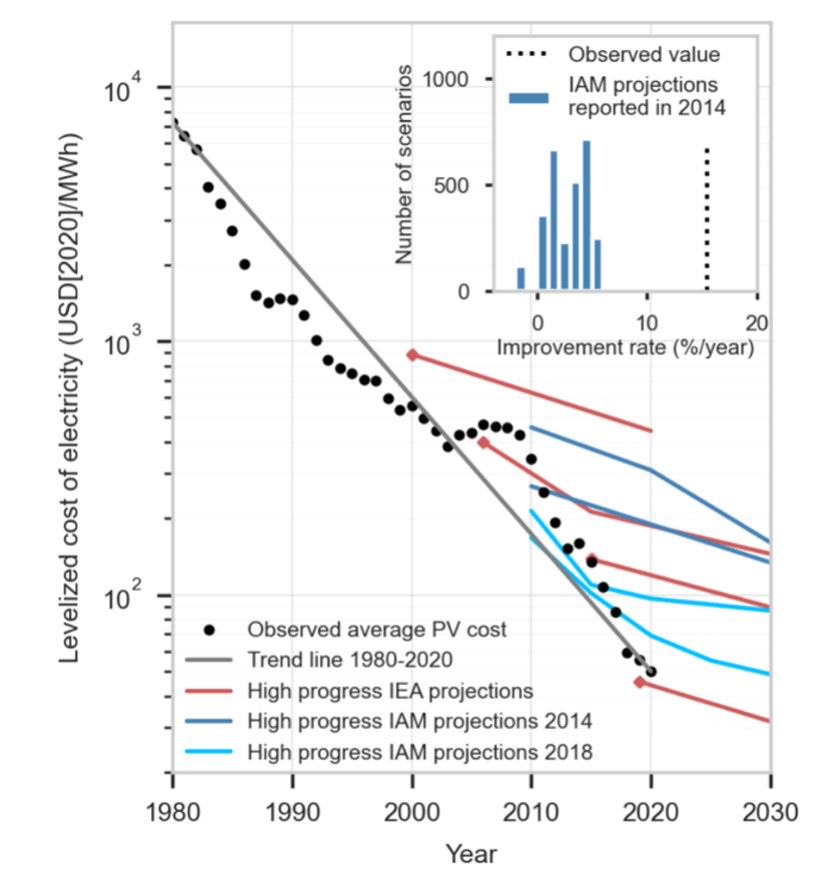
The authors note how quickly improvements in low-carbon technologies have proceeded relative to projections by international bodies like the International Energy Agency (IEA) or by integrated assessment models (IAMs). Observed data relative to these predictions are highlighted in Figure 2.
The Oxford team carried these observed rates of progress forward in time under a scenario called “Fast Transition.” The team did this by creating a statistical model suited to forecast trends that follow an S-shaped curve (referred to as Wright’s law), where growth occurs at the outset, followed by exponential growth and eventually slowing as the market saturates. This model is relatively simple, compared with other energy-economic models, as it didn’t attempt to represent any of the mechanics of learning or economic processes that are understood to determine energy systems. Rather, the model gave a range of statistical probabilities of how deployment trends would likely evolve given past trajectories.
The team tested this model on 50 other technologies and found it to be robust. The authors favored this approach because it relaxes constraints typically imposed by other energy system models, such as rigid assumptions about fixed costs. In the analysis, cost declines in solar, wind, batteries, and fuels produced using wind and solar electricity (P2X) are so significant that they facilitate the transition away from fossil sources within two decades.
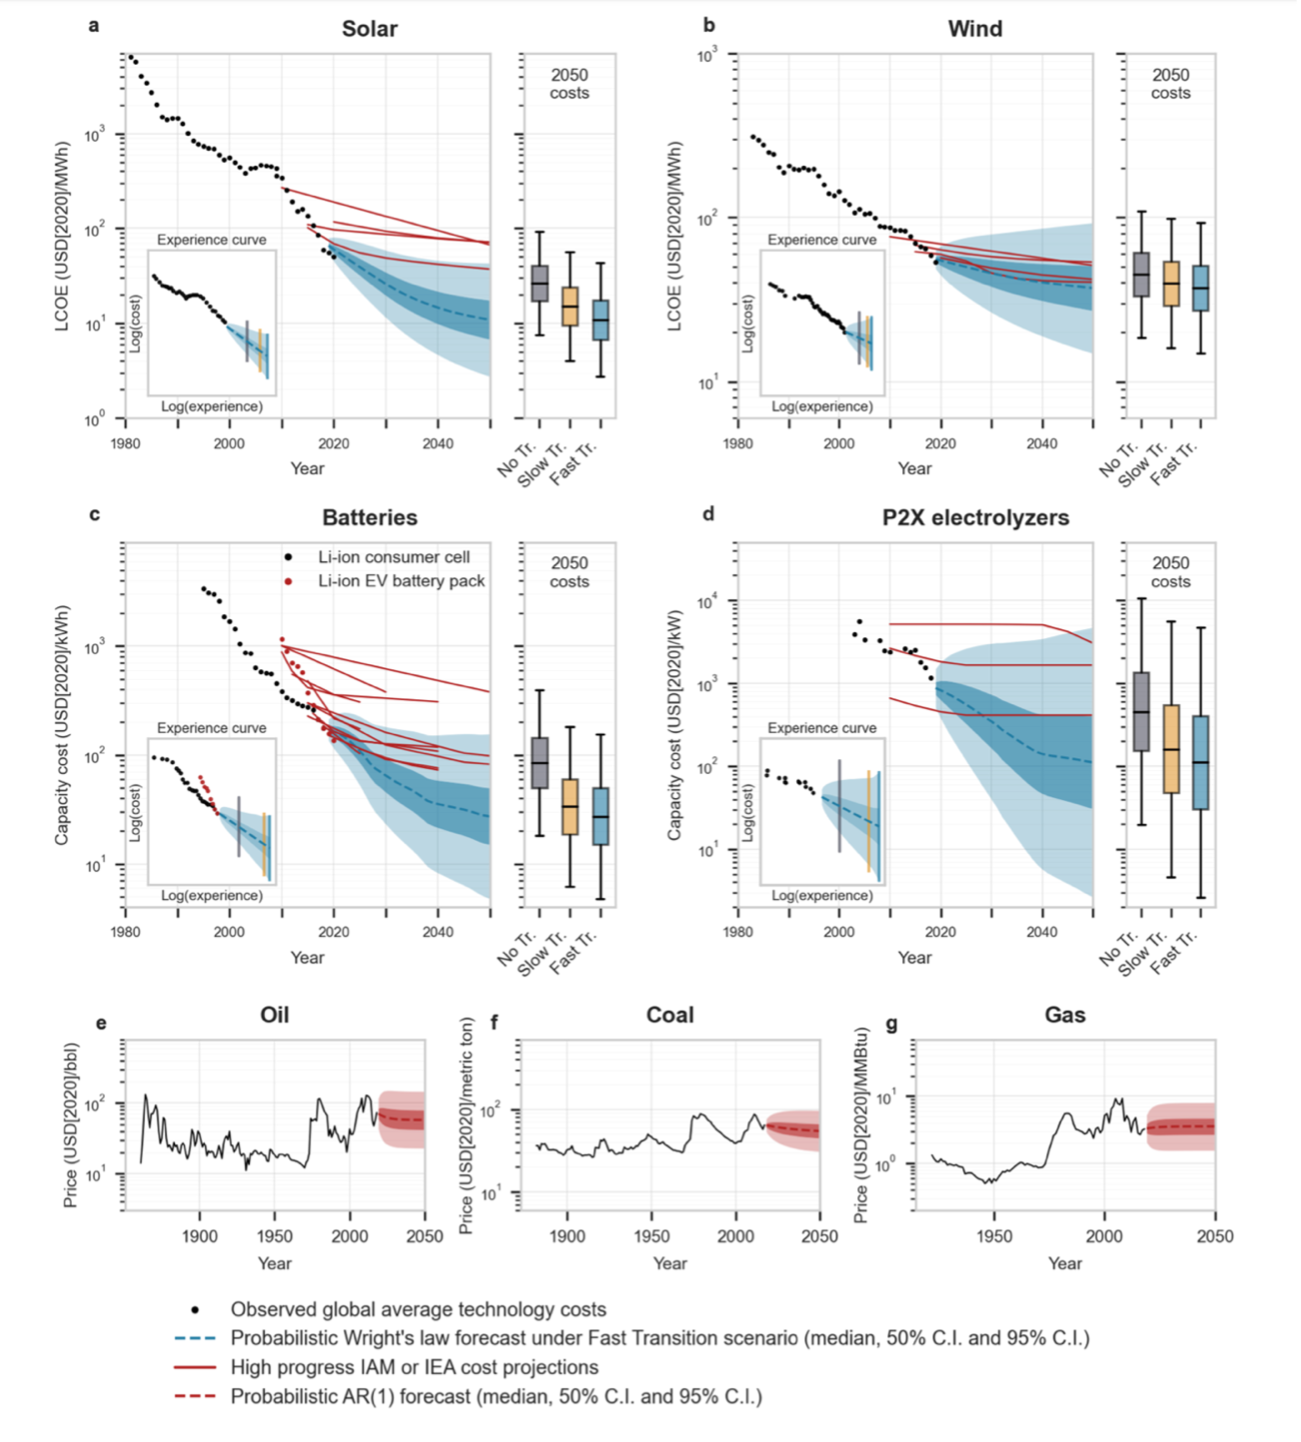
Although the authors project an optimistic future, they note that “while most of the Fast Transition is aligned with market forces, policies that discourage the use of fossil fuels will likely still be needed to fully decarbonize energy.” In other words, policy efforts to preserve incumbent technologies could dampen continued learning, thus limiting the speed of cost reduction in climate technologies and slowing their deployment.
Learning accelerates electrification
As the Oxford study highlights, IAMs have historically underestimated technological improvement in key renewable technologies that generate electricity, such as solar PV and wind. A new paper in Nature Energy led by Gunnar Luderer and colleagues from the Potsdam Institute for Climate Impact Research in Germany responds to this by providing new IAM-based projections about how fast electricity could become the world’s dominant energy provider.
Electrifying most energy end uses is crucial for fast decarbonization, but many prior IAM-based analyses have reflected traditional economic assumptions that electricity is expensive relative to fossil fuels and will be slow to overtake fossil-based sources. As a result, IAMs have previously provided more pessimistic projections of electrification growth rates, instead relying on higher—even socially unacceptable—estimates of future biomass energy or carbon sequestration to achieve climate targets.
The Potsdam team tweaked an IAM called REMIND-MAgPIE to explore more imaginative futures regarding electrification that would limit warming to either 1.5 degrees Celsius or well below 2°C. Four new features were incorporated into the model:
- Global climate policies enforce a hard cap on remaining carbon budgets to achieve climate targets
- Bioenergy and carbon capture and sequestration were explicitly constrained
- Strong, consistent policy incentives targeted battery-electric vehicles
- Recent learning curves for solar PV, wind, and battery storage were carried forward into the future
The results show substantially faster growth in global, economy-wide electrification relative to conventional IAM scenarios (see Figure 3), with the fastest electrification growth in the scenario pursuing the 1.5°C target. In this simulation, policies drove up the relative cost of combustible fuels, making electricity the most financially expedient energy carrier, with coal falling below 1 percent of total generation by 2035. Furthermore, hard constraints set on bioenergy in both scenarios reduce the land and water requirements for low-carbon energy, tempering concerns about environmental tradeoffs with decarbonization pathways.
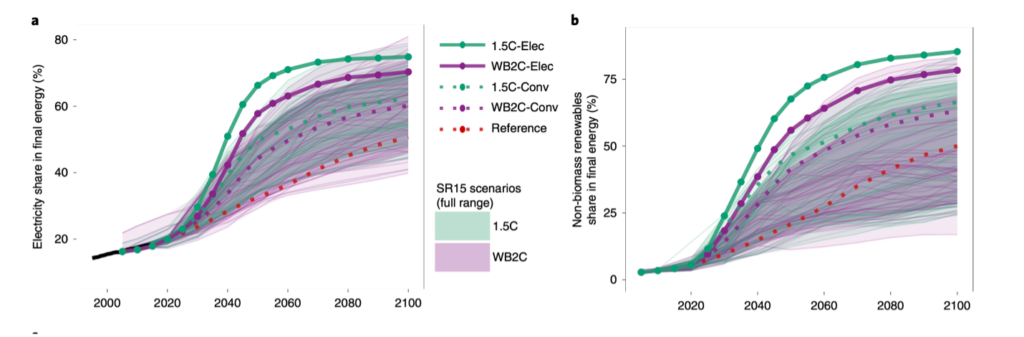
The implication of this exercise, even within the more constrained modeling world of IAMs (relative to the Way et al. probabilistic forecast), is that accelerated ambition is possible. The authors caution that learning rates driving technological change are an important factor, but only when combined with robust and sustained policy incentives. The authors also note that increases in electrification would be tempered without the imposition of constraints on carbon sequestration or biomass energy.
One takeaway from both studies is that optimism about learning rates could be naïve if the rates are taken for granted. This point was reinforced last year through a white paper from the Oxford Institute for Energy Studies, which cautioned against overreliance on past trends for solar and wind cost declines, noting how in the past some technological advancements have led to ongoing breakthroughs whereas others have led to stalemate. They also point out that learning curves, like those featured in Figure 1, do not directly measure learning and that other factors like raw material prices may underlay some changes in prices. Such critiques of the learning curve concept ultimately appear to be quite consistent with the findings of the Luderer et al. study, where learning curves were essential when reinforced with policy and other energy system guardrails.
Learning from machine learning
If optimistic assessments of the future of electricity are accurate, power grid operators will have to learn to manage a much larger, more complex, and data-intensive system. Innovations in systems management are becoming possible through emerging ML applications that engage computers to efficiently find optimal solutions to complex problems with minimal or no human supervision.
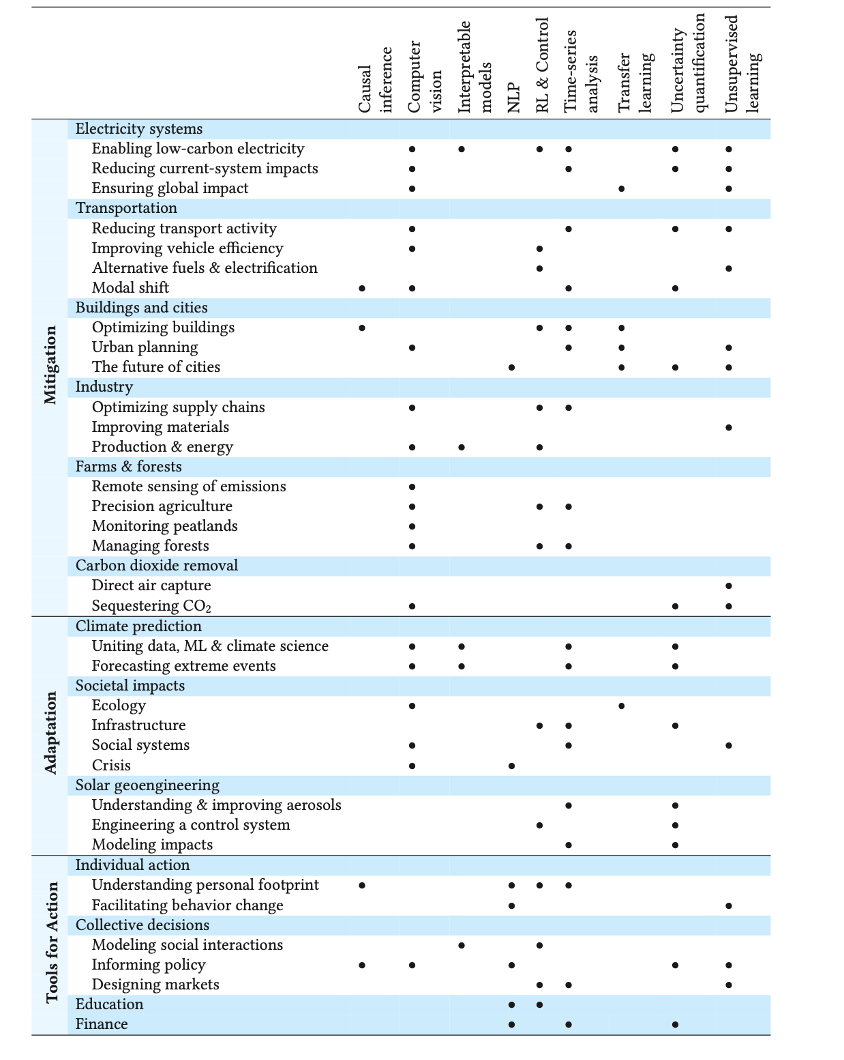
David Rolnick of McGill University and a large team of co-authors recently published a sprawling 100-page review in ACM Computing Surveys about the many ways to leverage ML in implementing climate solutions. Their literature review, summarized by Figure 4, identified many ML applications related to greenhouse gas mitigation, climate change adaptation, and various other tools for supporting climate action.
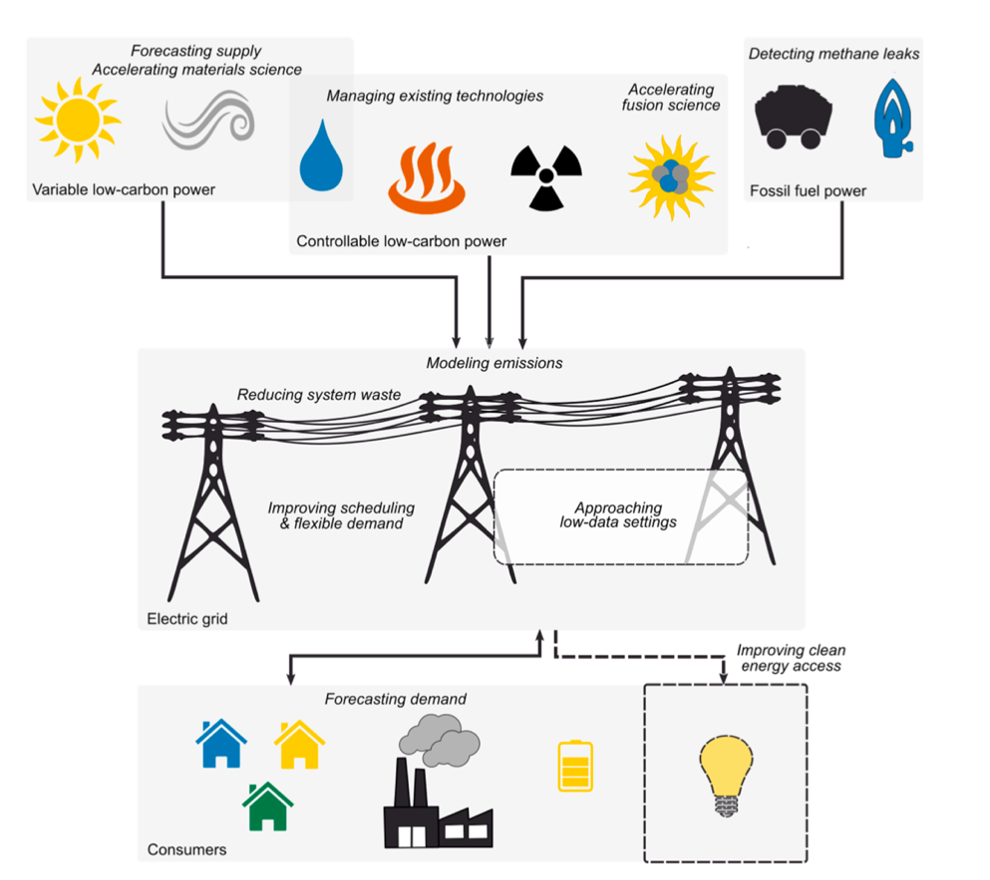
Zooming in on the electricity sector as one area of opportunity, Rolnick’s team identified a dozen areas where ML is gaining a foothold. Some examples of these opportunities include:
- Improving forecasts of variable energy supplies. One application is using image recognition to interpret satellite data to identify sources of rooftop solar previously unknown to grid operators. Another is analyzing climate and hydrologic data to make more accurate and near-term predictions of renewable energy production (e.g., from wind, sun, or hydro).
- Optimizing scheduling for variable electricity demand sources, especially in contexts where demand management may become more decentralized.
- Automating materials science research workflows to identify or predict materials that will contribute to new energy technologies such as solar fuels or batteries.
- Identifying ways to reduce transmission losses by developing predictive maintenance approaches that grid operators can use to reduce avoidable load shedding, emissions, and downtime.
Figure 6 summarizes this review of all the opportunities for ML applications in the electricity sector.
Like learning curves, assumptions of societal progress from ML are not a guarantee without proper guardrails and reinforcing mechanisms. To leverage ML’s potential societal benefit, ML techniques and code must be developed and shared in ways that are open, transparent, and interpretable by people and organizations, including those other than the largely private-sector actors who are working to develop and implement ML techniques. In other words, people must have the ability to learn from ML for it to be a true service to society.
Conclusion
Experience working with and producing new innovations can catalyze virtuous cycles of improvement that make once difficult and expensive undertakings easier and less costly. In the case of climate solutions, this gives reason to hope that the formidable task of decarbonizing the global economy will become easier over time. Recent empirical evidence from PV and wind deployment, among others, reinforce this optimism. As these rollouts play out, ML is likely to provide decision-makers, systems designers, and operators with tools needed to keep pace with the speed and complexity of a transforming energy system. Learning is not a guarantee, however, but may only be accomplished with sustained policy commitments.
Featured research
Jonas Grafström and Rahmatallah Poudineh, “A Critical Assessment of Learning Curves for Solar and Wind Power Technologies” (Oxford Institute for Energy Studies, 2021), https://www.oxfordenergy.org/wpcms/wp-content/uploads/2021/02/A-critical-assessment-of-learning-curves-for-solar-and-wind-power-technologies-EL-43.pdf.
Gunnar Luderer et al., “Impact of Declining Renewable Energy Costs on Electrification in Low-Emission Scenarios,” Nature Energy 7 (2022): 32–42, https://doi.org/10.1038/s41560-021-00937-z.
David Rolnick et al., “Tackling Climate Change with Machine Learning,” ACM Computing Surveys 55 (2023), https://doi.org/10.1145/3485128.
Rupert Way et al., “Empirically Grounded Technology Forecasts and the Energy Transition” (INET Oxford Working Paper No. 2021-01, 2021), https://www.inet.ox.ac.uk/files/energy_transition_paper-INET-working-paper.pdf.